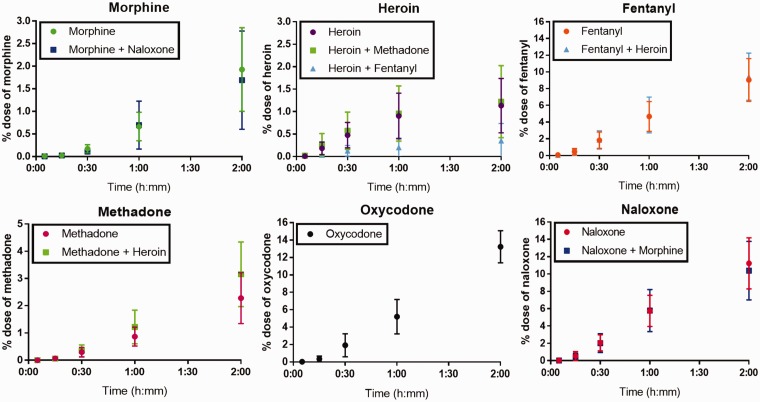
Figure 1.
Translocation of opioids across the trophoblast monolayer over time expressed as percentage of dose, showing mean ± standard deviation. The doses were either individual opioids (morphine, heroin, fentanyl, methadone, oxycodone, or naloxone) or mixtures of opioids (morphine + naloxone, heroin + methadone, or heroin + fentanyl). (A color version of this figure is available in the online journal.)

