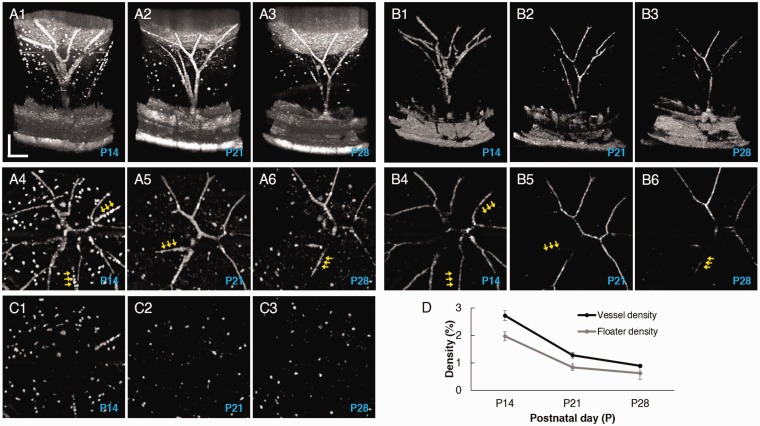
Figure 3.
Comparative (a) OCT and (b) OCTA images from a wild-type mouse eye measured at P14, P21, and P28. a1, a2, and a3 illustrate side views of OCT images and a4, a5, and a6 illustrate en face OCT projection images at the three time points. b1, b2, and b3 illustrate side views of OCTA images and b4, b5, and b6 illustrate en face OCTA projection images at the three time points. Yellow arrows indicate capillaries in functional loss. c1, c2, and c3 show floater images, which isolated from a4, a5, and a6, respectively. (d) Hyaloid vessel density and floater density measurements. Scale bars: 200 µm. (A color version of this figure is available in the online journal.)

