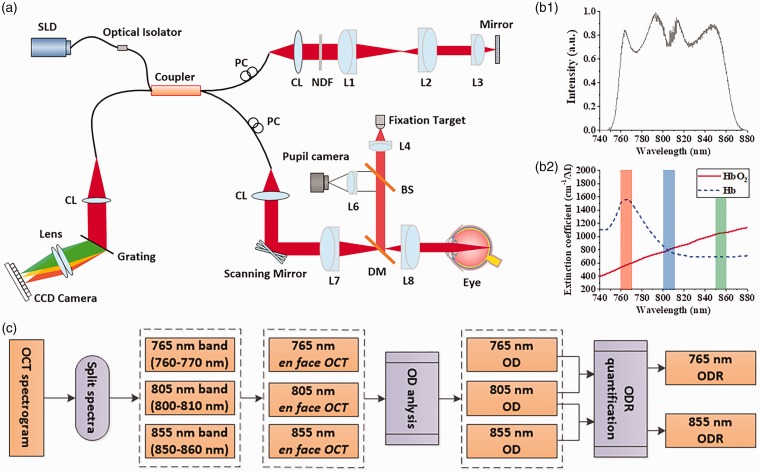
Figure 1.
(a) Schematic diagram of the OCT system. (b1) Spectral intensity of the NIR SLD light source. (b2) Absorption spectra of oxyhemoglobin (HbO2) and deoxyhemoglobin (Hb). The red, green, and blue rectangles indicate oxygen-sensitive 765 nm, oxygen-sensitive 855 nm, and oxygen-isosbestic 805 nm light windows used for ODR analysis. (c) Flow chart of ODR analysis at different spectral bands. CL: collimation lens; DM: dichroic mirror; Lenses: L1, L2, L3, L4, L5, L6, L7, L8; NDF: neutral density filter; PC: polarization controller; SLD: superluminescent diode; DM: dichroic mirror; BS: beam splitter. (A color version of this figure is available in the online journal.)

