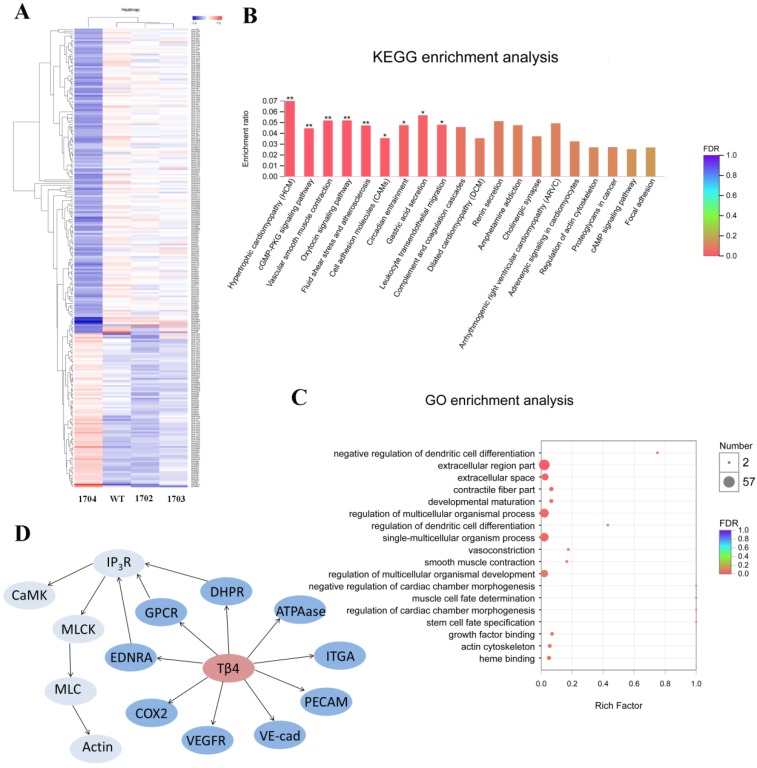
Figure 7.
RNA-seq analysis. A: Heatmap of differentially expressed genes. Red indicates higher expression genes in the sample, and blue indicates lower expression. B: KEGG enrichment analysis of differentially expressed genes. C: GO enrichment analysis of differentially expressed genes. D: Differentially expressed genes induced by Tβ4 gene knock-in, and interaction of these genes in the highly enriched pathway.

