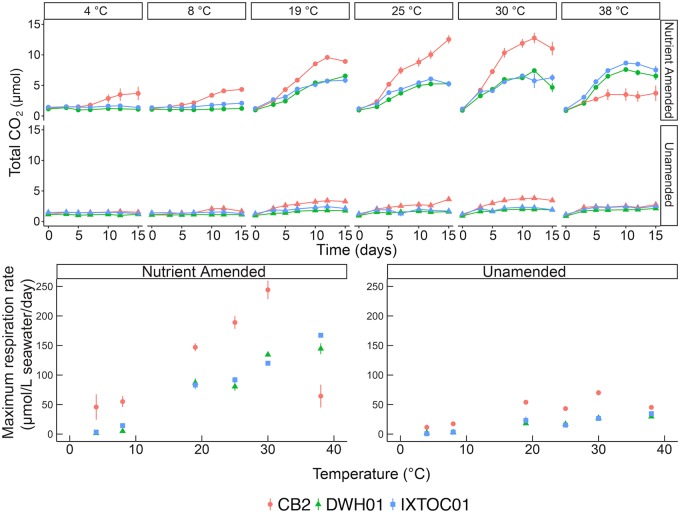
FIG 1.
Biodegradation rates, as determined by carbon dioxide accumulation (upper), and estimated maximum respiration rates (lower) according to temperature and nutrient amendment in microcosms of surface seawater. Scatterplots show average values from triplicate measurements. Error bars indicate standard deviations.

