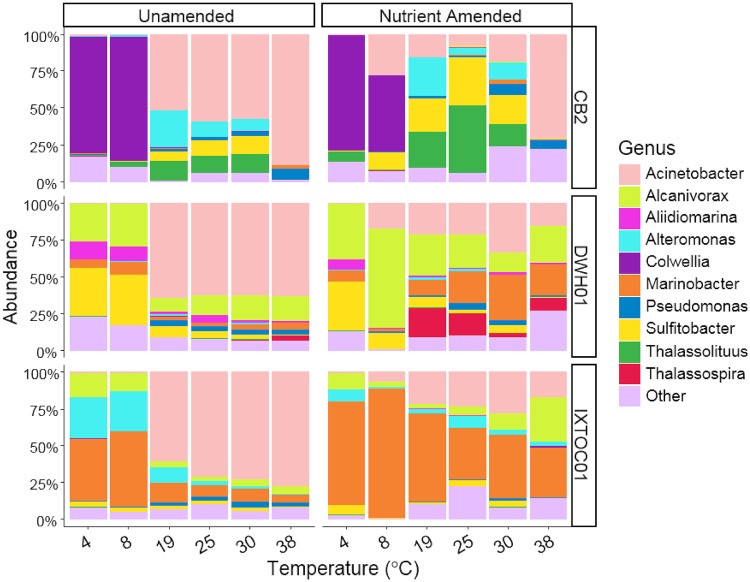
FIG 3.
Microbial community compositions in surface seawater microcosms from CB2 (upper), DWH01 (middle), and IXTOC01 (lower) sites. Barplots show the mean relative abundance of triplicate microcosms. Taxa are grouped at the genus level, and relative abundance was calculated relative to total sequences retrieved.

