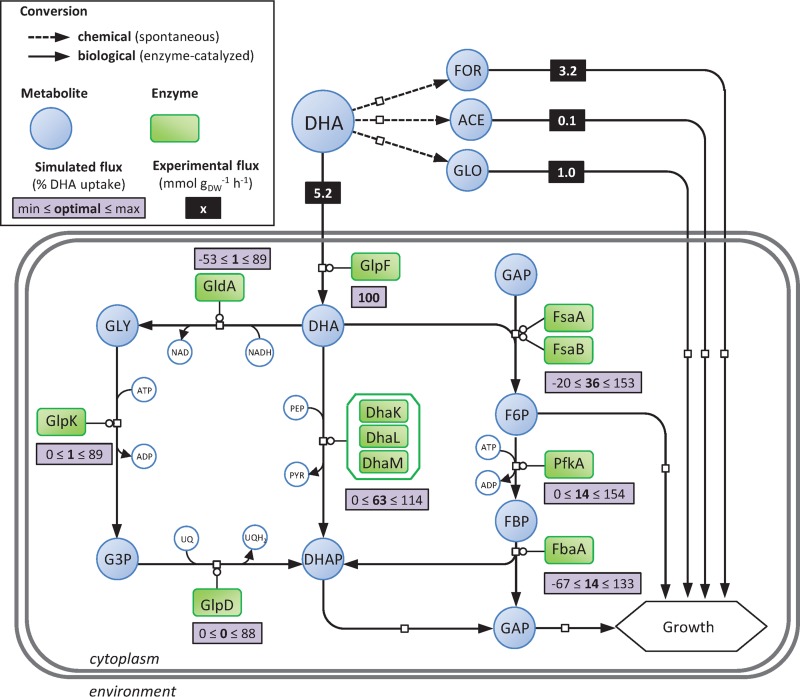
FIG 2.
Experimental and simulated fluxes through DHA metabolism of E. coli. Gray rectangles give the optimal and the ranges of simulated fluxes. Optimal simulated fluxes were obtained using flux balance analysis constrained with experimental uptake fluxes of the wild-type strain grown on modified M9 media containing 15 mM DHA (i.e., values given in black rectangle). Ranges of simulated fluxes were obtained using flux variability analysis when growth rate is constrained to 95% of the optimal value and with experimental uptake fluxes. Experimental flux values are given in mmol gDW−1 h−1, and simulated flux values are given in percent relative to DHA uptake rate. Shown are dihydroxyacetone kinase enzymes (DhaK, DhaL, and DhaM), fructose-6-phosphate aldolase enzymes (FsaA and FsaB), glycerol dehydrogenase enzyme (GldA), glycerol facilitator (GlpF), glycerol-3-phosphate dehydrogenase enzyme (GlpD), glycerol kinase enzyme (GlpK), fructose-bisphosphate aldolase enzyme (FbaA), 6-phosphofructokinase enzyme (PfkA), dihydroxyacetone (DHA), formate (FOR), acetate (ACE), glycolate (GLO), dihydroxyacetone phosphate (DHAP), fructose-6-phosphate (F6P), fructose-1,6-bisphosphate (FBP), glyceraldehyde-3-phosphate (GAP), glycerol (GLY), glycerol-3-phosphate (G3P), phosphoenolpyruvate (PEP), pyruvate (PYR), ubiquinone (UQ), ubiquinol (UQH2).

