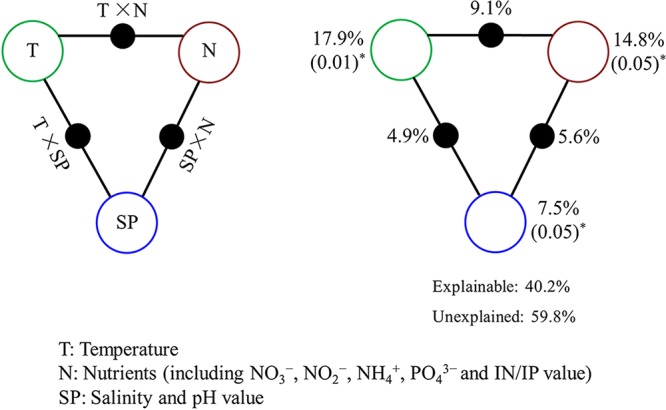
FIG 4.

Variation partitioning analysis of microbial distribution explained by environmental factors. (A) General outline. (B) Environmental parameters tested, including temperature (T), nutrients (N), and salinity-plus-pH value (SP). Each diagram represents the variation partitioned into the relative effects of each factor or combination of factors, in which area is proportional to the respective percentages of explained variation. The points of the triangles represent the variation explained by each factor alone. The sides of the triangles represent interactions of any two.
