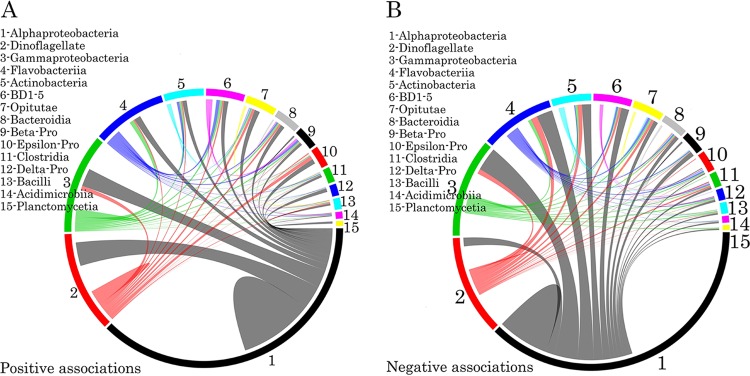
FIG 5.
Taxonomic patterns identified within the cooccurrence network. The top 15 interacting taxon groups are depicted as colored segments in a chord diagram, in which ribbons connecting two segments indicate copresence (A) and exclusion (B) links, respectively. The size of the ribbon is proportional to the number of links (copresence and exclusion) between the OTUs assigned to the respective segments, and the color is the segment (of the two involved) with the greater number of total links. Links are dominated by Alphaproteobacteria, Gammaproteobacteria, Flavobacteriia, and Actinobacteria. The chord diagram was generated using the circlized package in R based on the adjacency matrix for the taxon of interest. Beta-Pro, Betaproteobacteria; Epsilon-Pro, Epsilonproteobacteria; Delta-Pro, Deltaproteobacteria.

