
FIG 6.
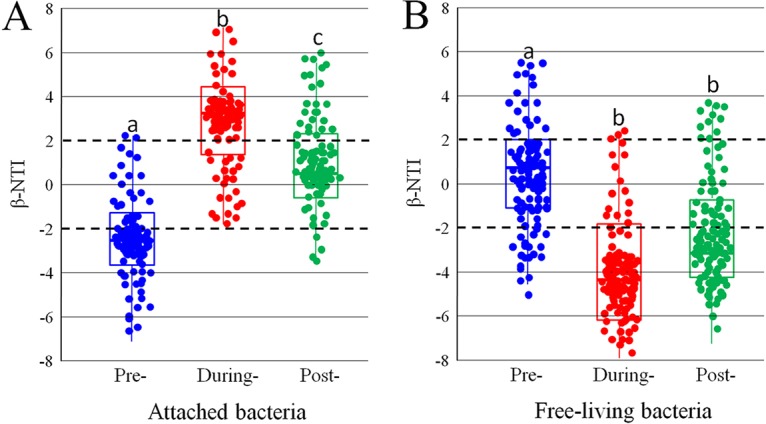
Patterns of β-NTI across HAB stages in attached taxa (A) and free-living taxa (B). Horizontal lines indicate upper and lower significance thresholds at β-NTI of +2 and −2, respectively.
Official websites use .gov
A
.gov website belongs to an official
government organization in the United States.
Secure .gov websites use HTTPS
A lock (
) or https:// means you've safely
connected to the .gov website. Share sensitive
information only on official, secure websites.
Patterns of β-NTI across HAB stages in attached taxa (A) and free-living taxa (B). Horizontal lines indicate upper and lower significance thresholds at β-NTI of +2 and −2, respectively.