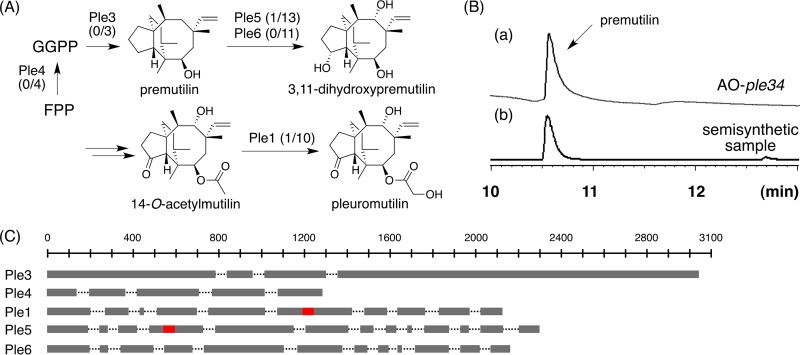
FIG 2.
(A) Biosynthetic pathway of pleuromutilin. The numbers in parentheses are the nonspliced introns in the cDNA recovered from the A. oryzae TF and the total number of introns of the corresponding gene. (B) GC-MS profiles of the metabolites from A. oryzae ple34 (a) and a synthetic sample (b). (C) Schematic view of the gene structures of ple3, ple4, ple1, ple5, and ple6. Exon regions are shown in shaded boxes. Nonspliced introns are shown in red boxes.

