
Figure 4:
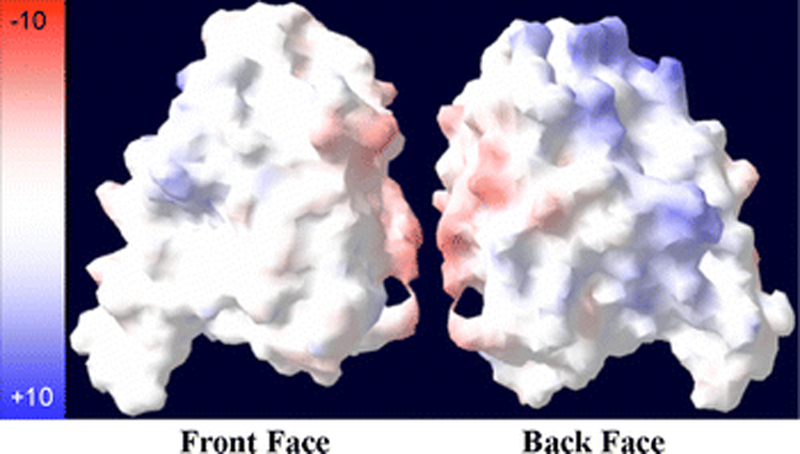
Surface maps of PNTE. Colors represent the degree of charge with red = negatively charged residues, white = uncharged residues, and blue = positively charged residues. Image was produced using the Swiss PDB Viewer (Guex and Peitsch, 1997).
Official websites use .gov
A
.gov website belongs to an official
government organization in the United States.
Secure .gov websites use HTTPS
A lock (
) or https:// means you've safely
connected to the .gov website. Share sensitive
information only on official, secure websites.
Surface maps of PNTE. Colors represent the degree of charge with red = negatively charged residues, white = uncharged residues, and blue = positively charged residues. Image was produced using the Swiss PDB Viewer (Guex and Peitsch, 1997).