
Figure 4. Representative ReCo-icSHAPE analysis showing effector-dependent chemical modification of the wild-type Lrh preQ1-II riboswitch.
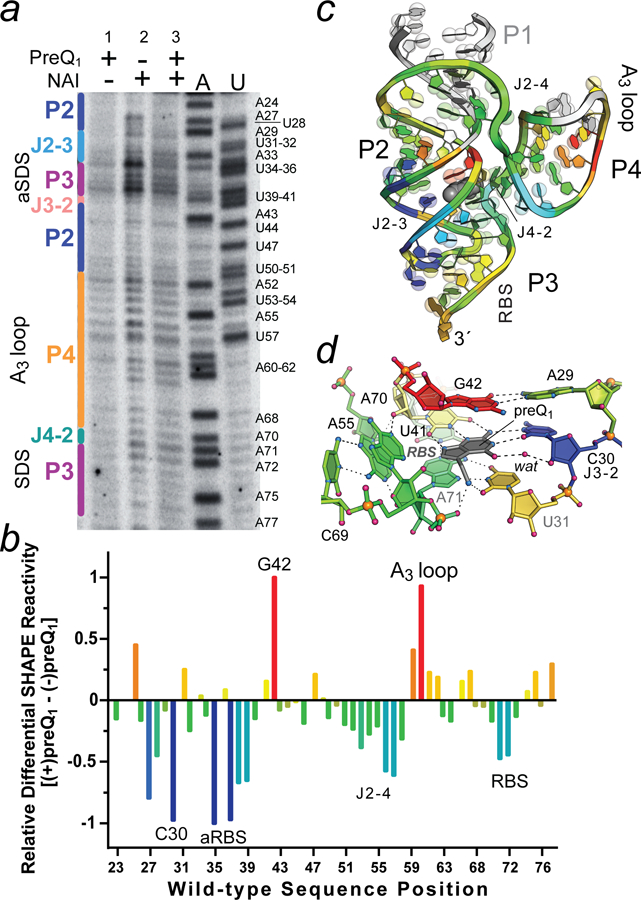
(a) Electrophoretic separation of 32P-labeled cDNAs generated from reporter coupled (ReCo) in cell (ic)SHAPE analysis conducted on bacteria exhibiting GFPuv gene “on” (no preQ1) and “off” (2 μM preQ1) states based on fluorescence emission (Fig. 3d,e and Figure S3). Lane 1: cells grown with preQ1 but no NAI added; lane 2: cells grown with no preQ1 but NAI added (gene on state); and lane 3: cells grown with preQ1 and NAI added (gene off state). A and U indicate reference nucleotide sequences with labels shown for each type. Secondary structure is labeled (left) based on the color scheme in Fig. 2b. (b) Heat map of the ReCo-icSHAPE analysis showing differences in acylation for the gene on and off states. Positive and negative values were normalized to the largest positive (red) and negative (blue) changes, which were set to 1. A24 was excluded from the analysis; aRBS is the anti-RBS sequence. The results are representative of duplicate trials for the conditions shown. (c) Ribbon diagram of the Lrh preQ1-II riboswitch showing the spatial distribution of differential ReCo-icSHAPE reactivity as a heat map from b. White regions in stem P1 (1–22) were not analyzed, and the wild-type P4 AAA (A3) loop was replaced by a UUCG tetraloop in the crystal structure, resulting in a mapping gap. PreQ1 is depicted as a gray CPK model. Bases are shown on semi-transparent spheres to emphasize purines (two spheres) and pyrimidines (one sphere). (d) Close-up of the preQ1-binding pocket rotated +90° relative to Fig. 2d. Heat mapping is derived from panel b.