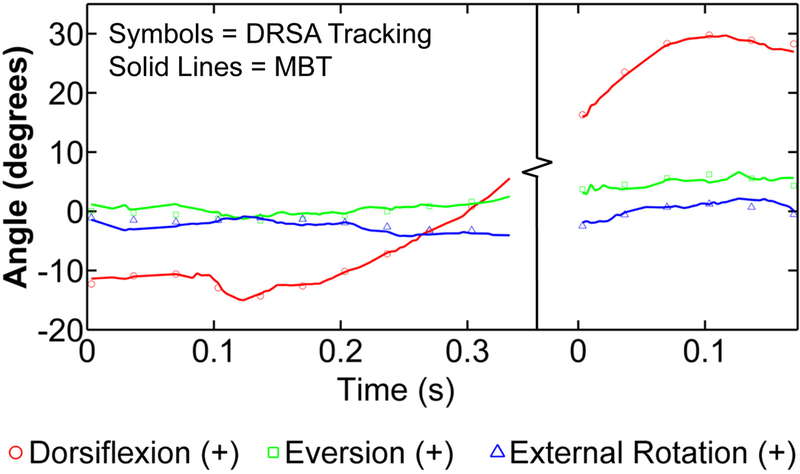
Figure 2:

Plots of the joint angles from the heel-strike and toe-off trials of the first specimen were combined to recreate the gait cycle. The single markers represent joint angle values determined through digital radiostereometric analysis and are plotted every 10 frames. The solid, lines demonstrate the results obtained through model-based tracking, plotted for every frame.
