
Figure 3. Cell-Type-Specific GO Genes Recapitulate Tissue-Specific Expression Signatures.
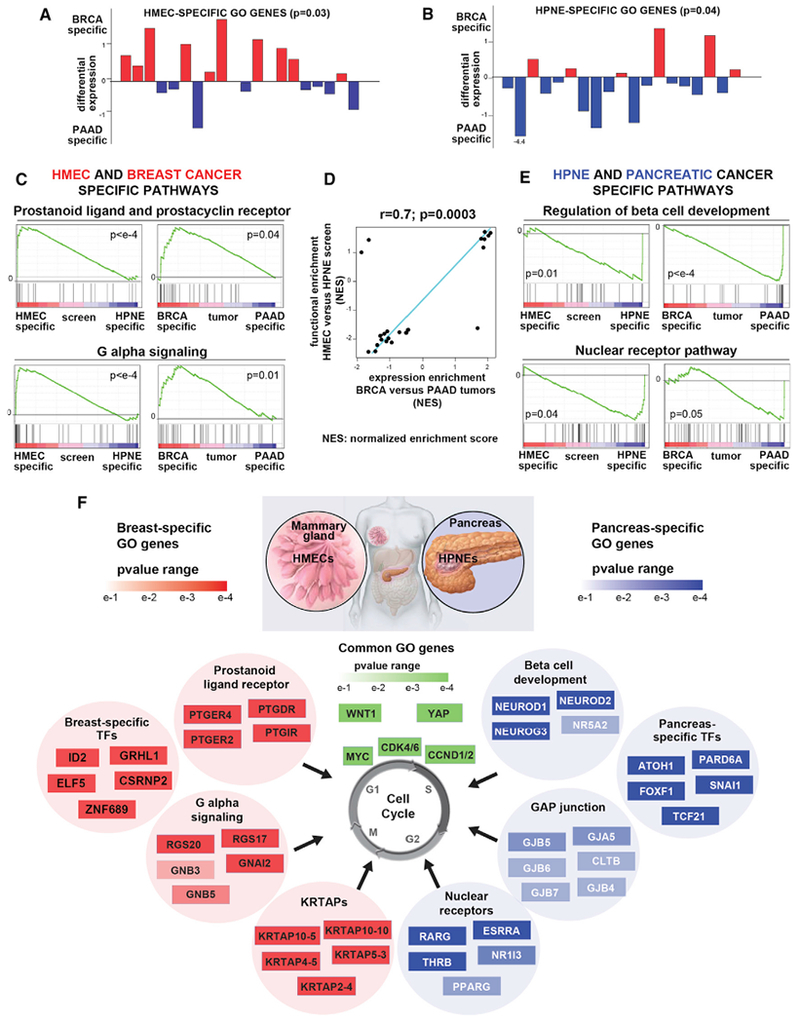
(A and B) Plot of differential expression score for each HMEC-specific (A) or HPNE-specific (B) GO genes. Specific GO genes are defined as genes that enrich ≥3 fold in the HMEC (A) or HPNE (B) screen and do not enrich in HPNE (A) or HMEC (B). p values were calculated by bootstrapping. See Figures S3A and S3B for STOP genes.
(C and E) Pathways with differential expression in breast versus pancreatic tumors and pathways with differential functional enrichment in HMEC versus HPNE screen were identified as described in (D) below. Examples of GSEA plots for the indicated pathways specific for BRCA/HMEC (C) or PAAD/HPNE (E) are shown.
(D) Similarity between pathways with differential expression in breast versus pancreatic tumors (RNA-seq-based differential expression score between BRCA and PAAD, y axis) and pathways with differential functional enrichment in the HMEC versus HPNE screens (differential enrichment score between HMEC and HPNE, x axis). Top-scoring GSEA pathways (FDR <0.1, absolute value of ES > 0.75) are shown (see STAR Methods). Pearson correlation coefficient (r) and p value are shown. NES, normalized enrichment score.
(F) Examples of pathways and/or gene sets enriched among the GO genes specific for HMEC (left) or HPNE (right) are shown. The top 4–6 most enriched genes from each pathway are shown with a heatmap representing their pE in HMEC or HPNE. GO genes that function as transcription factors (TFs) in HMEC or HPNE and are also specifically upregulated in the cognate cancer type are also shown. Genes shown in green were common GO genes in both cell lines.