
Figure 5. GO and STOP Genes Recapitulate Tissue-Specific Patterns of SCNA in Cancer.
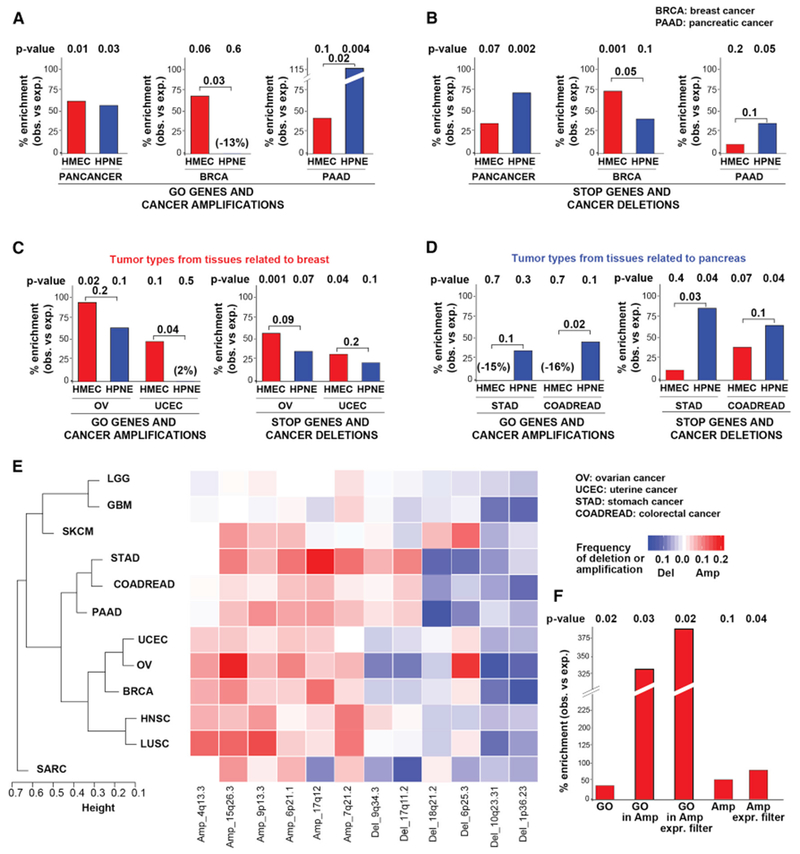
(A and B) Bar plots depicting the percent enrichment (over expected) of HMEC (red) or HPNE (blue) GO (A) or STOP (B) genes in amplicons (A) or deletions (B) from the indicated cancer type. SCNA data are from GISTIC2 analysis of primary tumors (see STAR Methods). p values are from one-tailed Fisher’s exact test. For the tumor-type-specific analyses, bootstrapping-based analysis was performed to test whether the difference between the enrichment for the HMEC and HPNE screens was statistically significant (see STAR Methods).
(C and D) Bar plots as in (A) depicting percent enrichment of HMEC and HPNE GO and STOP genes in tumors related to breast (C) or to pancreas (D).
(E) Heatmap and hierarchical clustering of SCNA patterns across tumor types (Table S5E). Representative SCNAs are shown.
(F) Bar plot showing % enrichment (over expected) of the indicated HMEC gene set among genes depleted from RNAi screens in breast cancer cell lines. GO, top 1,000 HMEC enriched genes; GO in Amp, GO genes within BRCA focal amplicons; GO in Amp Expr Filter, GO genes within BRCA focal amplicons after filtering out low expressed genes in BRCA (bottom 30%); Amp, genes in BRCA focal amplicons; Amp Expr Filter,: genes in BRCA focal amplicons after filtering out low expressed genes. p values are from one-tailed Fisher’s exact test.