
Figure 6. STOP and GO Genes Help Predict Aneuploidy Patterns and Recapitulate Proliferation Phenotypes in Tumors.
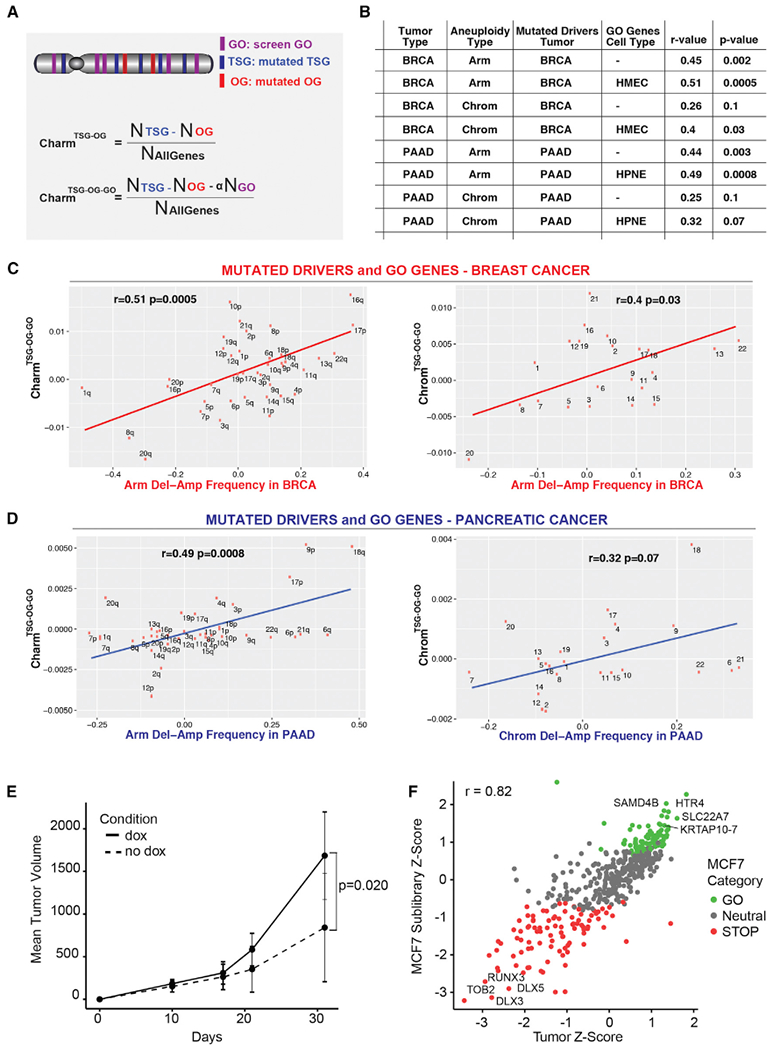
(A) Schematics showing the calculation of the Charm score for mutated drivers (TSG and OG) alone (CharmTSG-OG; above) and mutated drivers plus GO proliferation drivers (CharmTSG-OG-GO; below). Similar methods were utilized to determine the Chrom scores (see STAR Methods).
(B) Table showing the relationship between the deletion-amplification frequency of arm (or chromosomes) for the indicated tumor types with the Charm or Chrom scores derived using the mutated TSG/OG from BRCA or PAAD and the GO genes (when indicated) from HMEC or HPNE. Pearson’s correlation coefficient (r) and p value are indicated.
(C and D) Correlation between the CharmTSG-OG-GO (or ChromTSG-OG-GO) score determined using the mutated TSG/OG from BRCA (C) or PAAD (D) and the HMEC GO genes (C) or HPNE GO genes (D) and the deletion-amplification frequency in BRCA (C) or PAAD (D) at the arm or chromosome level, as indicated.
(E) MCF7 tumor volume over time following implantation of ORF sublibrary cells into cleared mammary fat pads of NSG mice. Tumor volumes from each flank in a single mouse were summed, and the mean was computed across all dox mice (n = 9) and all no dox mice (n = 3). Error bars ± SD. p value was determined by one-tailed Student’s t test.
(F) Scatterplot of the Z score for genes in the MCF7 Sublibrary proliferation screen versus MCF7 Tumor screen, colored according to MCF7 Sublibrary gene category. Pearson’s product-moment correlation coefficient (r) is indicated.
See also Figures S6 and S7 and Table S6.