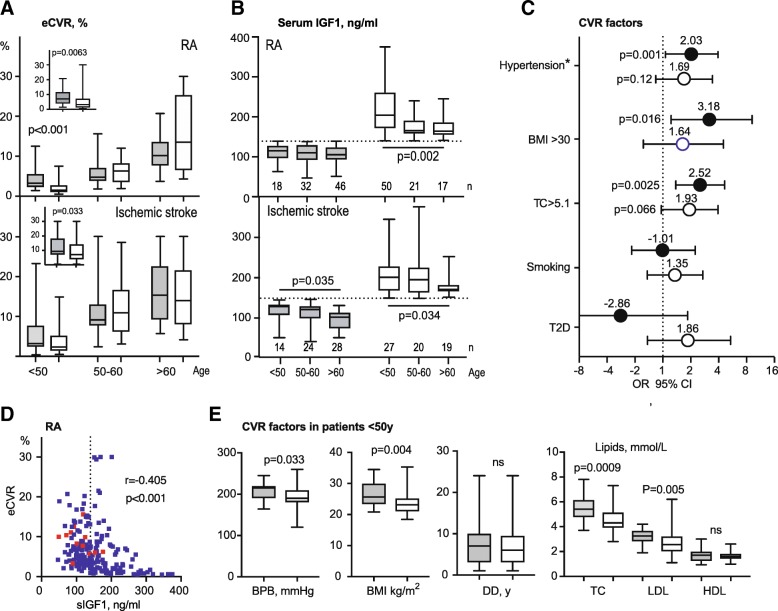
Fig. 1.
Low serum levels of IGF1 are associated with higher estimated cardiovascular risk (eCVR) in RA patients. a eCVR was calculated in 184 female RA patients and in 132 female incidental ischemic stroke using the Framingham lipid algorithm. The median level of IGF1 formed the IGF1high and IGF1low groups. Box plots show eCVR separately for IGF1low and IGF1hi groups stratified by age. Embedded box plots show eCVR in the total cohorts. b Box plots show levels of IGF1 separately for IGF1low and IGF1hi groups stratified by age. Box plots present median, interquartile range. P values are calculated with the Mann-Whitney U test. c The forest plot shows the difference in traditional CVR factors between IGF1low and IGF1hi groups is shown as odds ratio (OR) with 95% confidence interval (CI). Filled circles indicate RA cohort (n = 184), open circles Ischemic stroke cohort (n = 132). The p values are obtained by chi-square statistics. BMI, body mass index; TC, total cholesterol; T2D, type 2 diabetes. d The Spearman correlation between eCVR and serum levels of IGF1 in the RA cohort is shown as a dot plot. The dotted line indicates the median IGF1 level separating IGF1low and IGF1hi groups. Red dots indicate the patients, who developed CV events during the prospective follow-up. e The comparison of CVR factors between IGF1low (n = 18) and IGF1hi (n = 50) patients within the youngest age group < 50 years. Box plots present median, interquartile range. P-values are calculated with the Mann-Whitney U test. BPB, blood pressure burden (a sum of systolic and diastolic BP); BMI, body mass index; DD, disease duration; TC, total cholesterol; LDL, low-density lipoproteins; HDL, high-density lipoproteins

