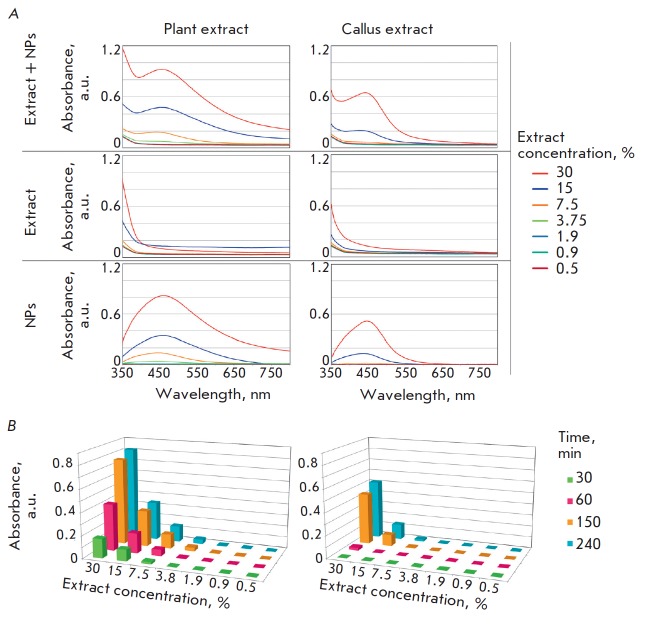
Fig. 2.
Analysis of the nanoparticle synthesis efficiency. A – absorption spectra of an extract and nanoparticle mixture (top panels), an extract (middle panels), and nanoparticles (bottom panels) in a range of 350–800 nm, which were produced during 240 minute incubation of an aqueous silver nitrate solution (1 g/L) and plant (left panels) or callus (right panels) extracts at 0.5–30% concentrations (shown in colors). B – intensity of LSPR peaks during the synthesis of silver NPs, depending on the concentrations of plant (left panel) and callus (right panel) extracts and the time of incubation (shown in colors) of extracts and an aqueous silver nitrate solution (1 g/L)

