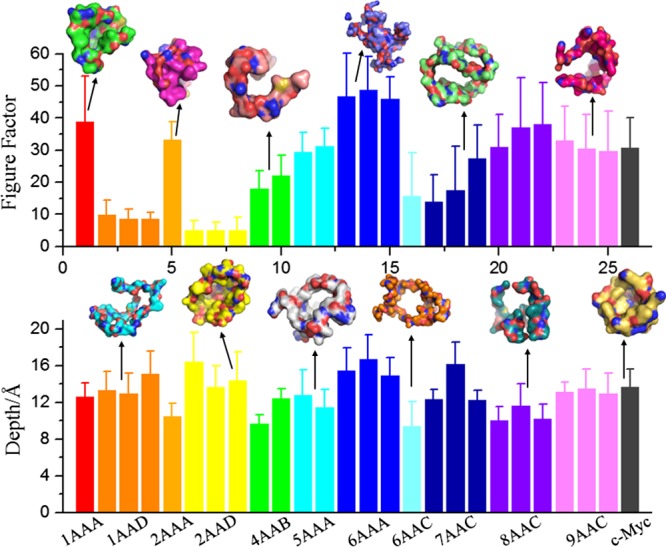
Figure 3.

Histograms showing the average figure factor and maximum depth of potentially druggable cavities in different ensembles of single-chain IDPs. Error bars represent standard deviations. Representative cavities with figure factor and depth values similar to the average values in each ensemble are displayed as space filled models.
