
Figure 4.
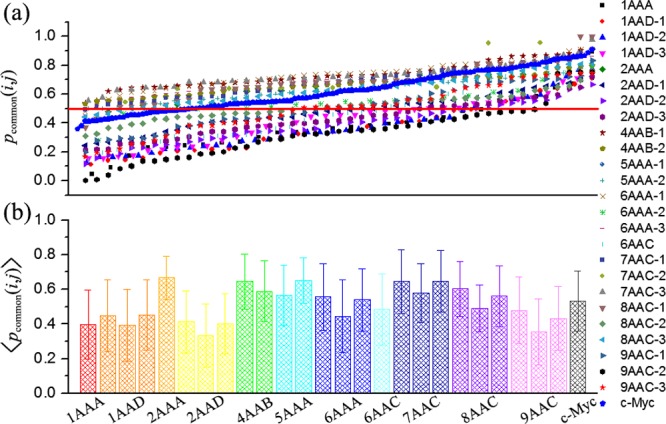
Common-atom percentage of potentially druggable cavities in different ensembles. (a) pcommon(i,j) plotted in ascending order for each ensemble. The data points are evenly spaced within each ensemble to span the full horizontal range. Some values were omitted to avoid crowding. Red lines indicate the level of 50%. (b) Average of pcommon(i,j) in different ensembles. Error bars represent the standard deviation.