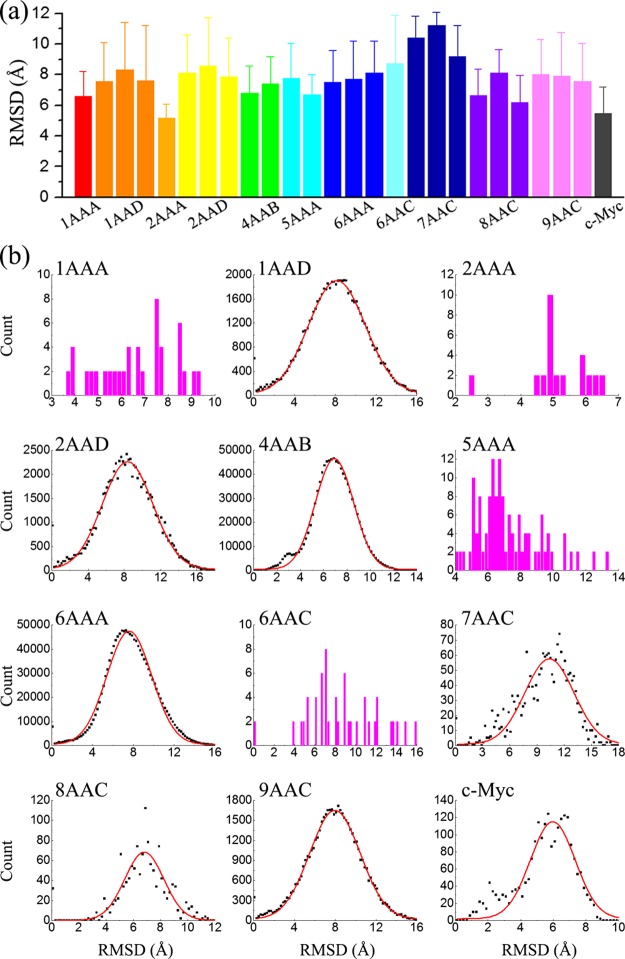
Figure 6.
(a) Average rmsd of potentially druggable cavities for different ensembles. Error bars represent standard deviations. (b) Distribution of the rmsd of potentially druggable cavities for different conformational ensembles. Red lines are fitted to the scattering data with a Gaussian function.

