Figure 2.

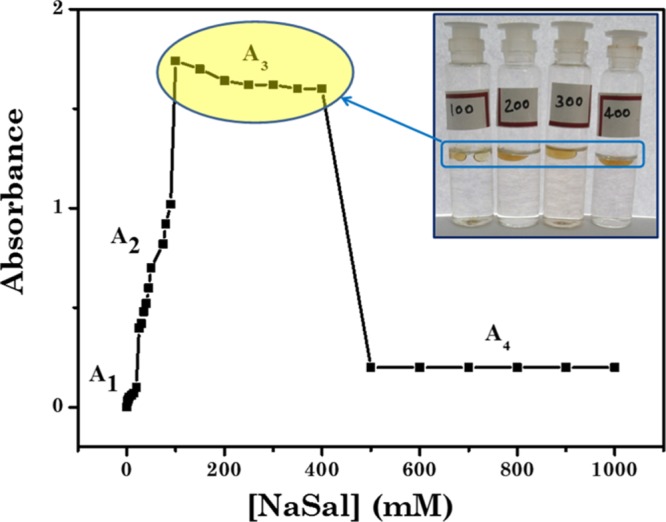
Turbidity curve showcasing the phase boundaries of the C8EMeImBr/NaSal system with 112.5 mM concentration of C8EMeImBr and variable concentrations of NaSal.

Turbidity curve showcasing the phase boundaries of the C8EMeImBr/NaSal system with 112.5 mM concentration of C8EMeImBr and variable concentrations of NaSal.