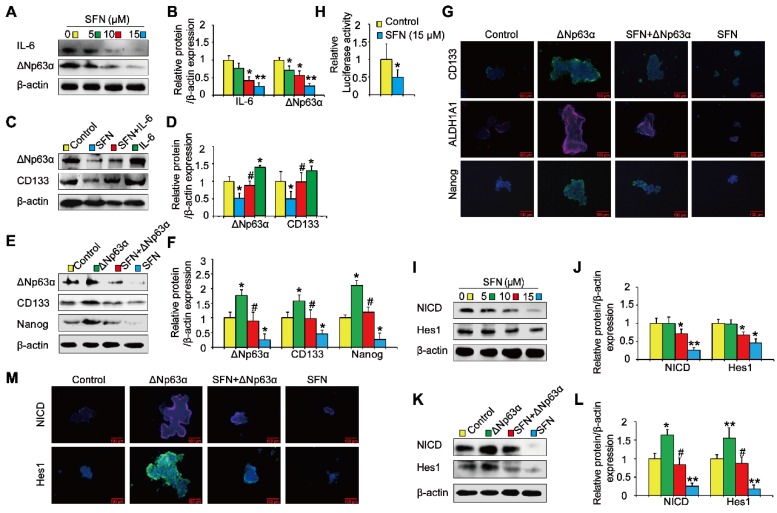
Figure 8.
IL-6/ΔNp63α/Notch axis mediates the suppression of long-term TS exposure-induced lung CSC-like properties by SFN. (A) THBE tumorspheres were treated with different SFN concentrations (0, 5, 10, and 15 µM) for 7 days. The protein expression levels of IL-6 and ΔNp63α were detected by western blotting. (B) The levels of the indicated proteins relative to β-actin were assessed by densitometric analysis. (C) THBE sphere-forming cells were pretreated with SFN (15 μM) for 3 days, stimulated by IL-6 (20 ng/mL) for 24 h, then ΔNp63α and CD133 expression were detected by western blotting. (D) Densitometry results are shown as the fold-change compared to the control group after β-actin normalization. (E) Tumorspheres formed by THBE cells were transfected with ΔNp63α plasmids, cultured in the presence or absence of 15 µM SFN for 4 days, and the protein levels of ΔNp63α and lung CSCs markers were then measured by western blotting. (F) Densitometry results are shown as the fold-change compared to the control group after β-actin normalization. (G) Immunofluorescence staining of CD133, ALDH1A1, and Nanog in THBE sphere-forming cells for the indicated groups, original magnification, 200×. (H) The luciferase activity of the Notch1 promoter was measured in the THBE sphere-forming cells after 4 days of incubation with SFN. (I) Western blot analyses were performed, and (J) the relative protein levels of NICD and Hes1 were determined. (K) NICD and Hes1 expression in ΔNp63α transfected THBE sphere-forming cells with or without of SFN (15 µM) treatment. (L) Densitometric analyses of western blots of NICD and Hes1 were performed after β-actin normalization. (M) Immunofluorescence staining of NICD and Hes1 in THBE sphere-forming cells for the indicated groups, original magnification, 200×. Three independent experiments were performed. Data are expressed as the mean ± SD. Significance was assessed by one-way ANOVA or unpaired two-tailed Student's t tests. * P < 0.05, ** P < 0.01 compared to the control group; # P < 0.05 compared to the SFN treatment group.

