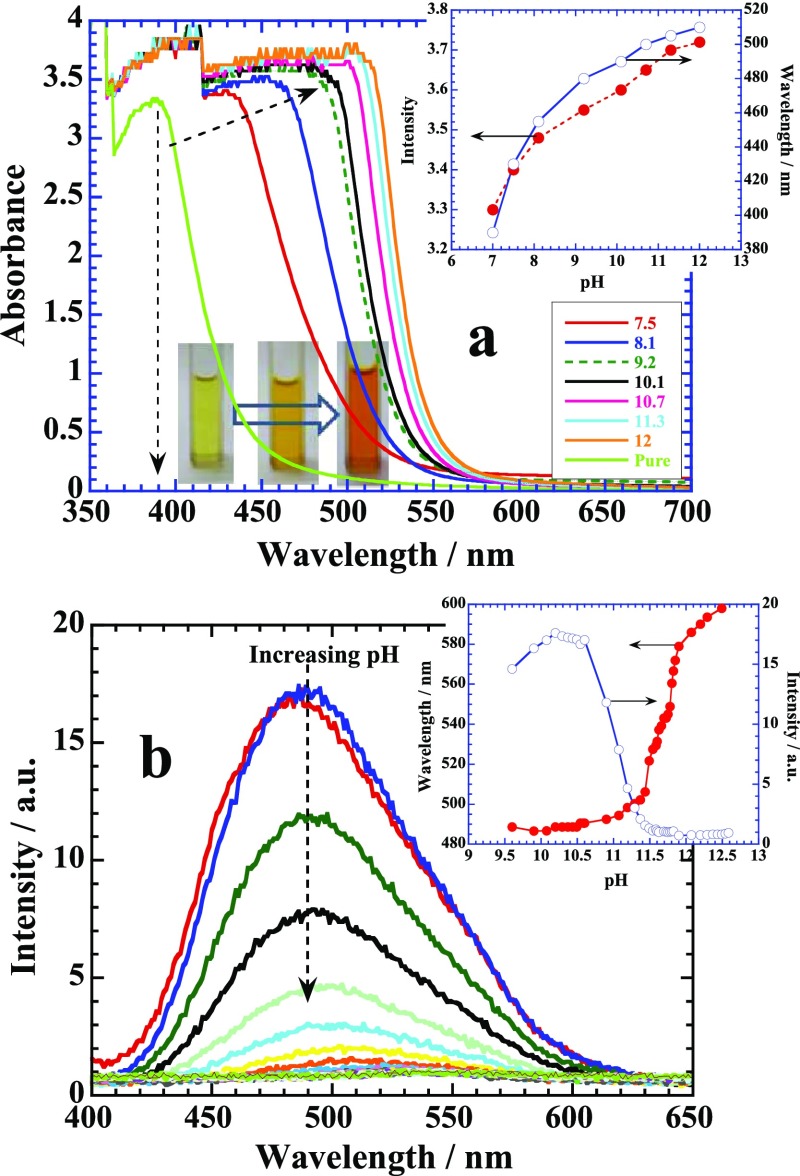
Figure 2.
(a) UV–visible titration of naringin with NaOH. Inset: Color change with the change in pH of the solution from 7 to 12. Plot of intensity and wavelength change with pH. (b) Plots of fluorescence emission of the same titration with pH. Inset: Variation in the emission intensity and wavelength with pH. See details in the text.

