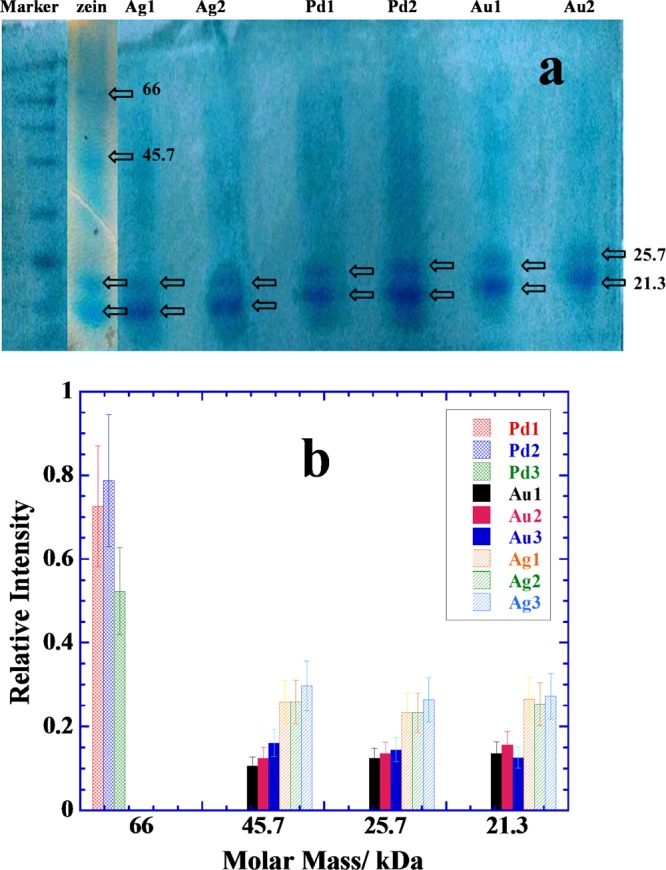
Figure 8.

(a) Typical SDS page analysis scans of extracted zein protein fractions picked by the samples of naringin-conjugated NPs prepared with 0.25 mM metal salts and different concentrations of naringin (5 mM = 1, 10 mM = 2, and 15 mM = 3). See NPs images in Figures 3–5. (b) Comparative bar plots of relative amounts of the most abundant proteins picked by different samples. See details in the text.
