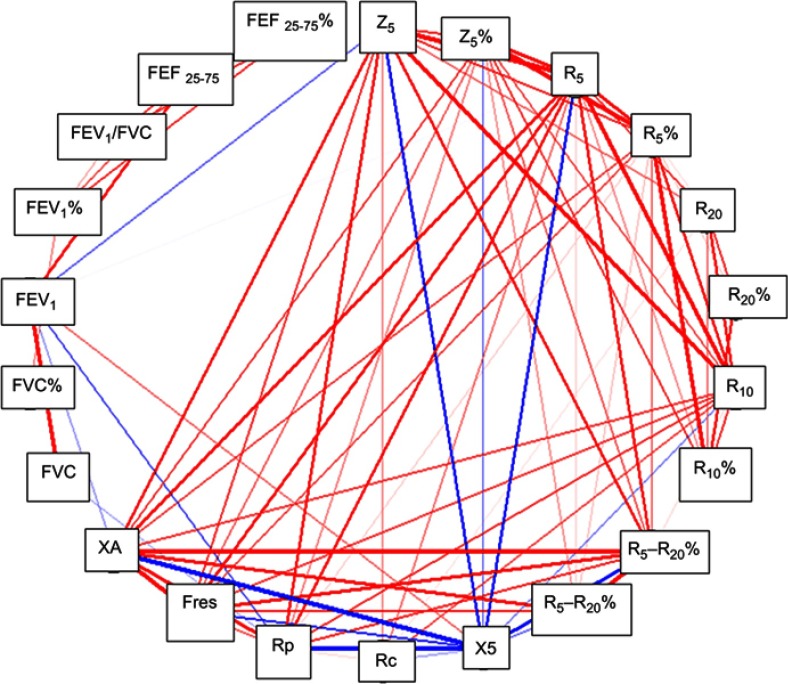
Figure 2.
Correlation between parameters of spirometry and IOS. Only frequencies higher than 0.7 (red lines) or less than −0.7 (blue lines) are shown. The thickness of the lines is proportional to the frequency.
Note: (%) after every abbreviation means relative or percentual values.
Abbreviations: Z5, impedance; R5, reactance at 5 Hz; R10, reactance at 10 Hz; R20, reactance at 20 Hz; R5-R20, difference between R5 and R20; Fres, resonance frequency; Rc, central resistance; Rp, peripheral resistance; XA, reactance area; FEF 25-75, forced expiratory flow at 25-75% (absolute values).

