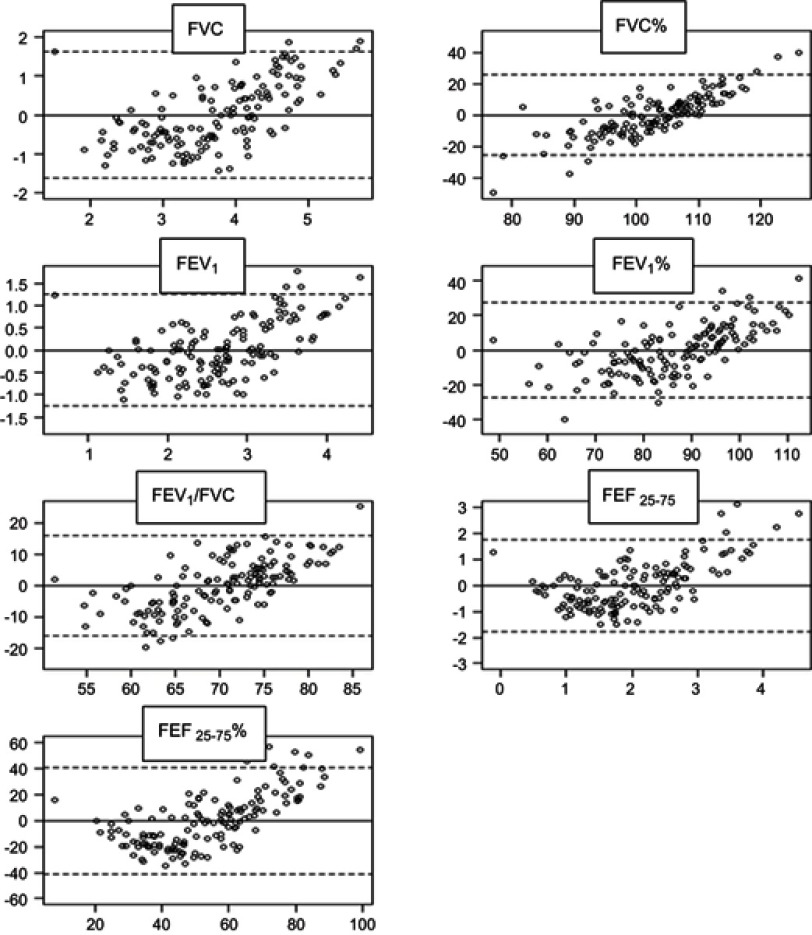
Figure 3.
Bland–Altman plots of agreement between real spirometry values and predictive values from IOS. Models showed an acceptable bias for FEV1%, FVC% , and FEV1/FVC values.
Abbreviation: FVC, forced vital capacity; FEV 1, forced in expiratory volume in 1 second; FEF 25-75, forced expiratory flow at 25%-75% (absolute values) ; FEF 25-75 % , forced expiratory flow at 25%-75% (percentage).

