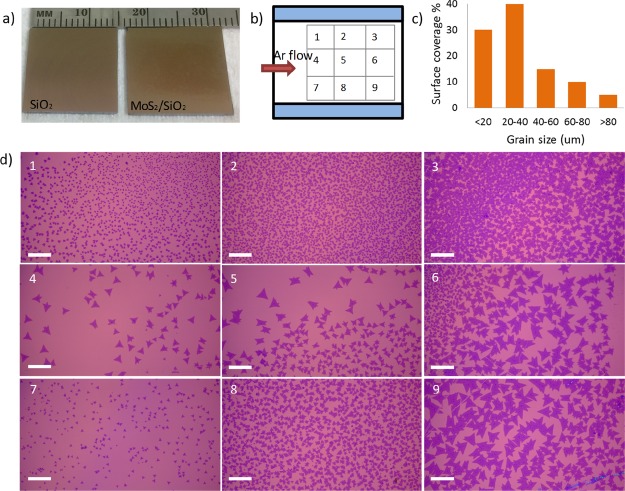
Figure 2.
Growth results. (a) Contrast between bare Si/SiO2 substrate and substrate after the growth of MoS2. (b) Sketch of the sample with the corresponding image positions. The blue regions marked here are outside of the boat. (c) Grain-size histogram with the surface coverage. (d) Optical images of the substrate at the positions specified in (b). Scale bar is 100 μm in each image.

