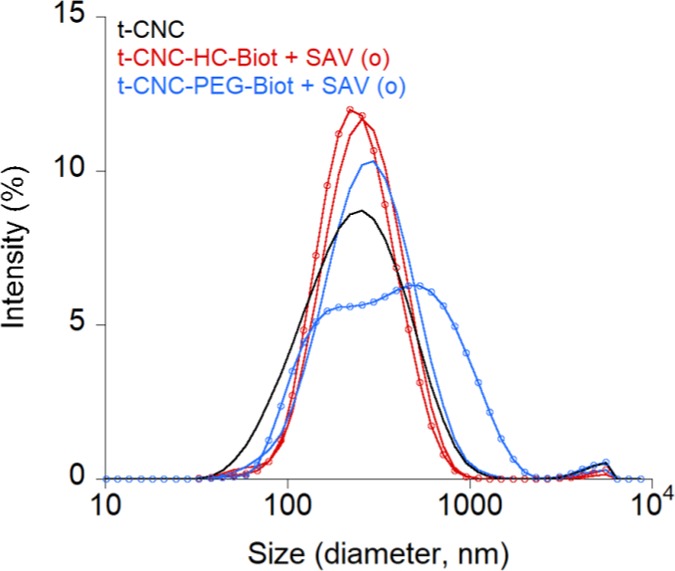
Figure 4.

Size distribution (intensity) curves of t-CNC at 0.2 g L–1 aqueous dispersions of unmodified t-CNC (black line) and both biotin-functionalized t-CNC (t-CNC–HC-Biot, red lines, and t-CNC–PEG-Biot, blue lines, respectively). The size distribution plots after streptavidin addition are indicated by the lines + circles.
