Figure 1.
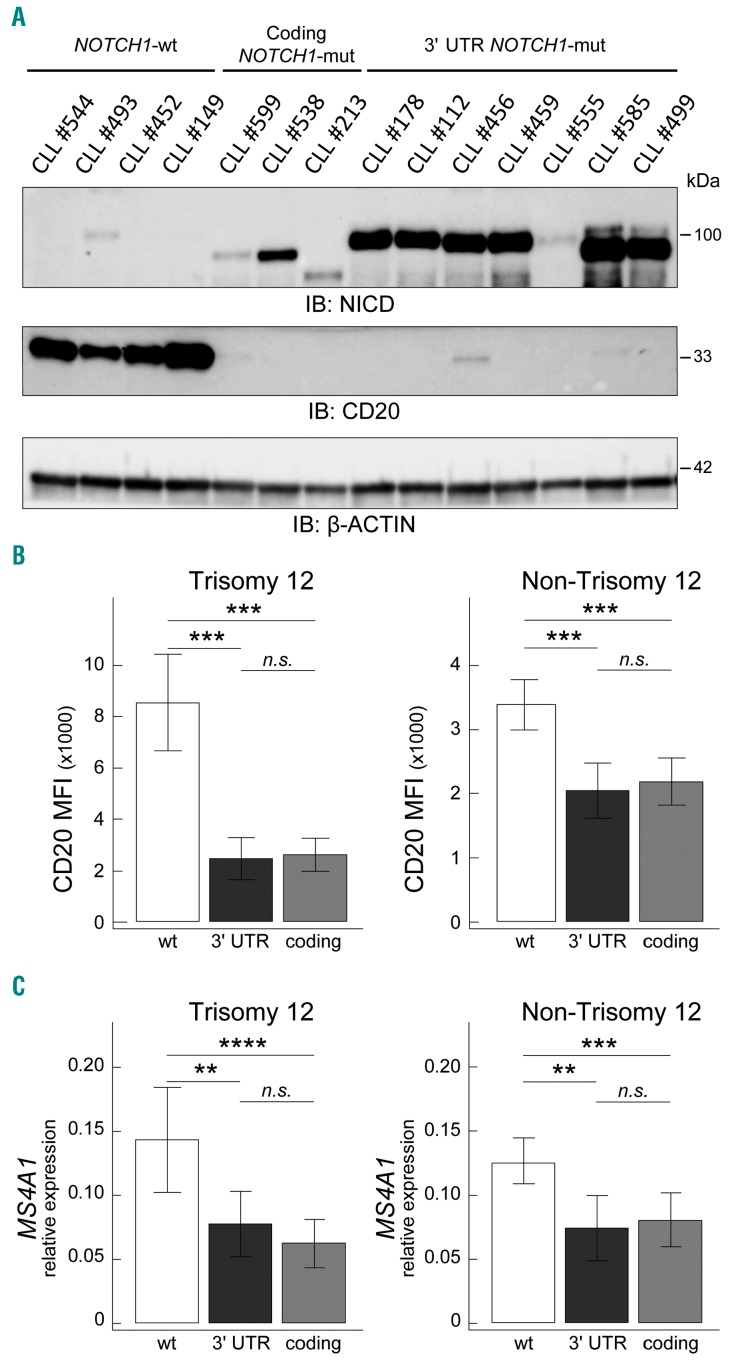
Correlation between 3′ UTR NOTCH1 mutations and CD20 expression. (A) Western blot showing NICD (upper panel) and CD20 (L26 epitope, with short exposure, lower panel) protein expression in representative CLL cases, i.e. four NOTCH1-wt cases, three coding NOTCH1-mut cases (2 cases with the g.139390648CAG>C, c.7541-7542delCT, p.P2514Rfs*4; 1 case with the g.139390929AC>A, c.7261delG, p.V2421*), and seven 3′ UTR NOTCH1-mut cases (5 cases with the g.139390152T>C, c.*7668+371A>G; 2 cases with the g.139390145T>C, c.*7668+378A>G). β-actin was used as loading control. Identification (ID) number according to Online Supplementary Table S1 is also reported. (B) Bar graphs showing CD20 protein expression levels evaluated by flow cytometry in 112 trisomy 12 CLL cases (9 3′ UTR NOTCH1-mut cases, 35 coding NOTCH1-mut cases, 68 NOTCH1-wt cases) and 550 non-trisomy 12 CLL cases (17 3′ UTR NOTCH1-mut cases, 55 coding NOTCH1-mut cases, 478 NOTCH1-wt cases). Data were analyzed using the t test. *: P<0.05; **, P<0.01; ***, P<0.001; n.s.= not significant. Bar graphs represent mean values, error bars represent the 95% confidence interval (CI). Abbreviations: NOTCH1-wt: wt; 3′ UTR NOTCH1-mut: 3′ UTR; coding NOTCH1-mut: coding. (C) Bar graphs showing MS4A1 transcript expression levels, as evaluated by quantitative real-time polymerase chain reaction, in 662 CLL cases subdivided according to NOTCH1 mutational status as reported in (B). Data were analyzed using the t test. *P<0.05; **P<0.01; ***P<0.001; n.s.= not significant. Bar graphs represent mean values, error bars represent the 95% confidence interval. NOTCH1-wt: wt; 3′ UTR NOTCH1-mut: 3′ UTR; coding NOTCH1-mut: coding.

