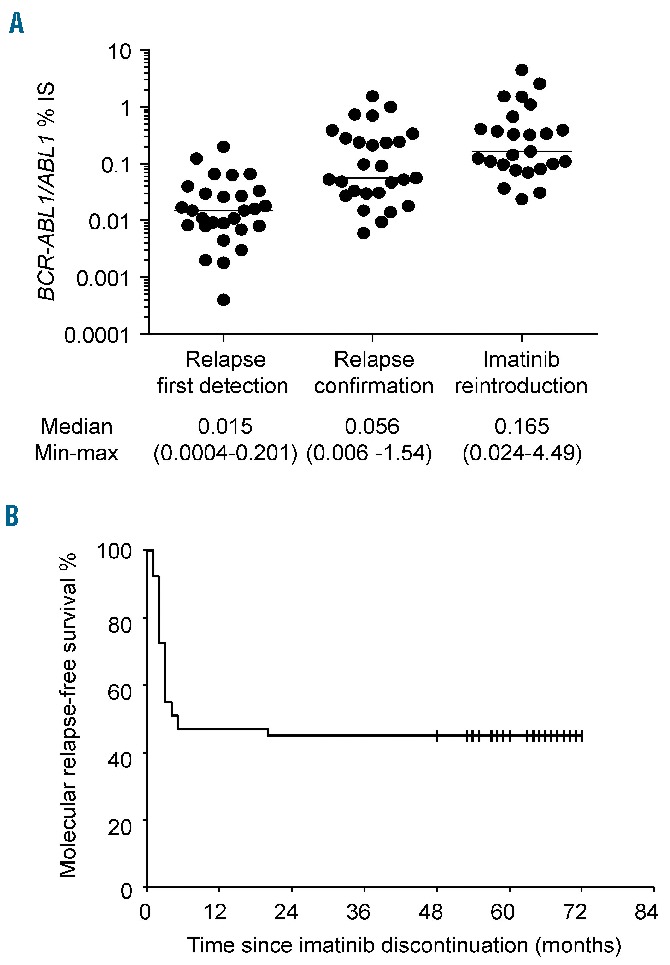
Figure 1.

Evolution of BCR-ABL1 transcripts in relapsing patients and molecular relapse-free survival. (A) Scatter dot plots represent BCR-ABL1 IS % for each individual relapsing patient at first detection of relapse, relapse confirmation and at imatinib reintroduction; median values (horizontal bars) are also shown. (B) Kaplan-Meier estimate of molecular relapse-free survival defined as the time interval between imatinib discontinuation and first occurrence of molecular relapse or death, whichever came first. Data were censored at last molecular assessment for patients who were alive and had not relapsed.
