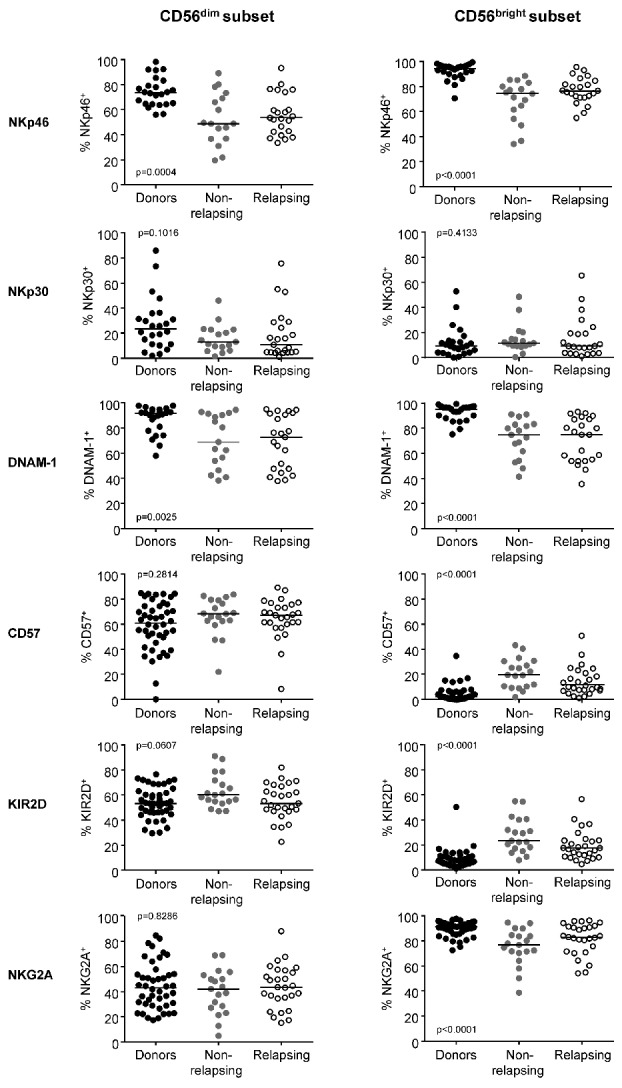
Figure 4.

Expression of natural killer cell receptors in CD56dim and CD56bright natural killer cell subsets. Scatter dot plots for healthy donors (black dots, n=44), non-relapsing patients (filled gray dots, n=19) and relapsing patients (empty black dots, n=27) with median values (horizontal bars) are shown. Overall P value (by the Kruskall-Wallis test) is indicated for each panel.
