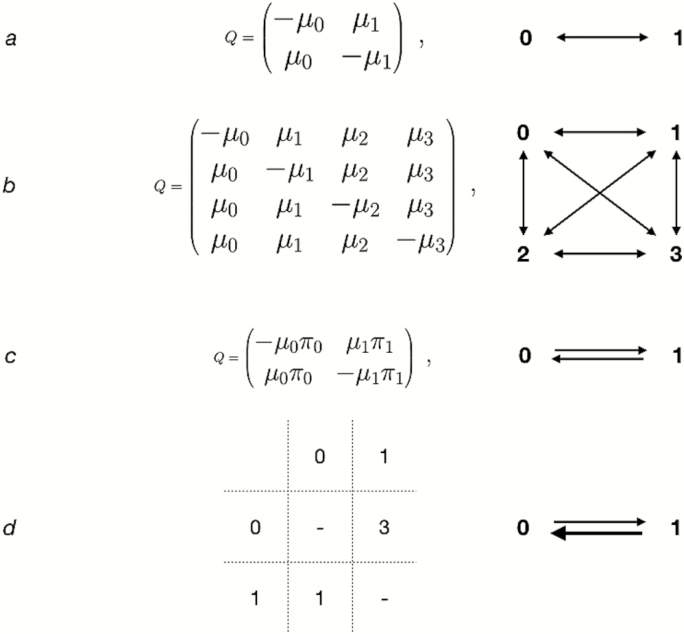
Fig. 7.
A schematic showing common assumptions about character evolution. (a) shows the Q-matrix under the Mk model for binary data. This corresponds to the assumptions on the right-hand side of the figure, that a character is equally likely to change from a 0 state to a 1 state as the reverse. (b) shows the same assumptions, expanded to a multistate character. (c) shows a Q-matrix with each character state allowed to have a different stationary character frequency, enabling different 0 → 1 and 1 → 0 rates. (d) displays a parsimony step matrix that penalizes 0 → 1 transitions. In (d), the rows represent the starting state, and the columns represent the state to which the character is changing.

