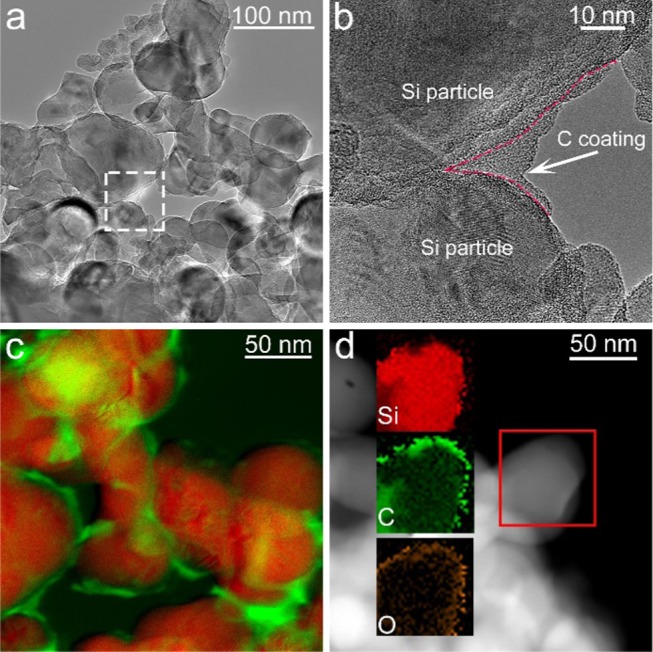
Figure 1.

Electron microscopy of Si/C composite particles. (a) Bright-field TEM image. (b) HRTEM image of the area denoted by the dashed white box in (a). (c) EFTEM image indicating the presence of a carbon shell. Si and C are shown in red and green, respectively, in (c). (d) HAADF-STEM image and EDX maps of Si, C, and O for the area denoted by the solid red box.
