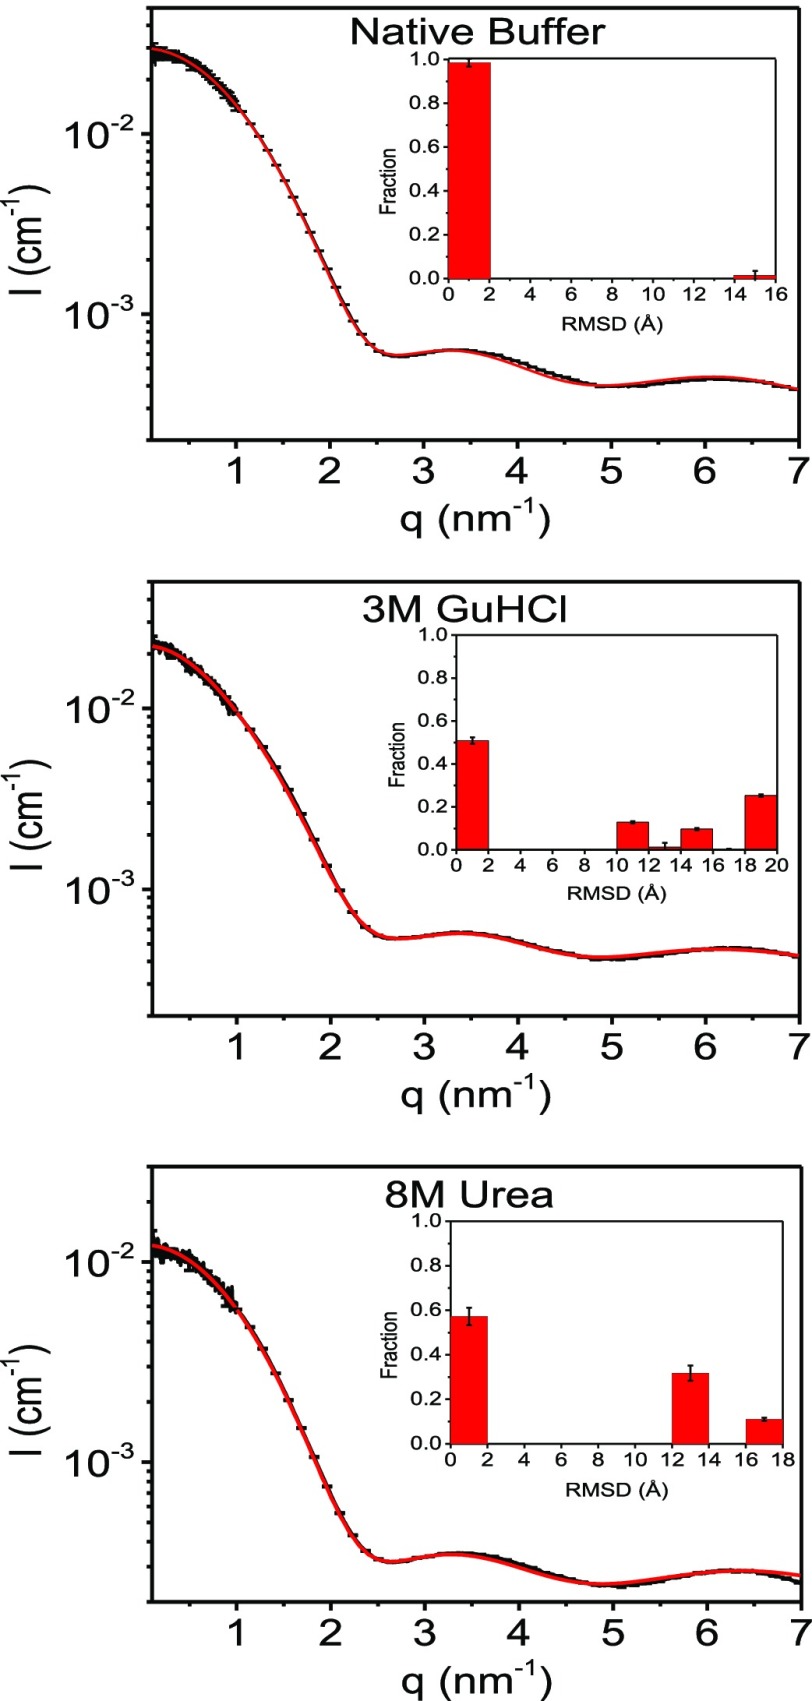
Figure 3.
Background subtracted scattering intensity curve of lysozyme in 50 mM sodium acetate buffer (pH = 4.5), and in the same buffer with 3 M GuHCl, or 8 M urea (black curves), as indicated. The red curves are the best-fitted models, based on the computed ensemble of lysozyme conformations (see text). The insets show the fraction of conformations as a function of their rmsd values (with respect to the crystal structure).

