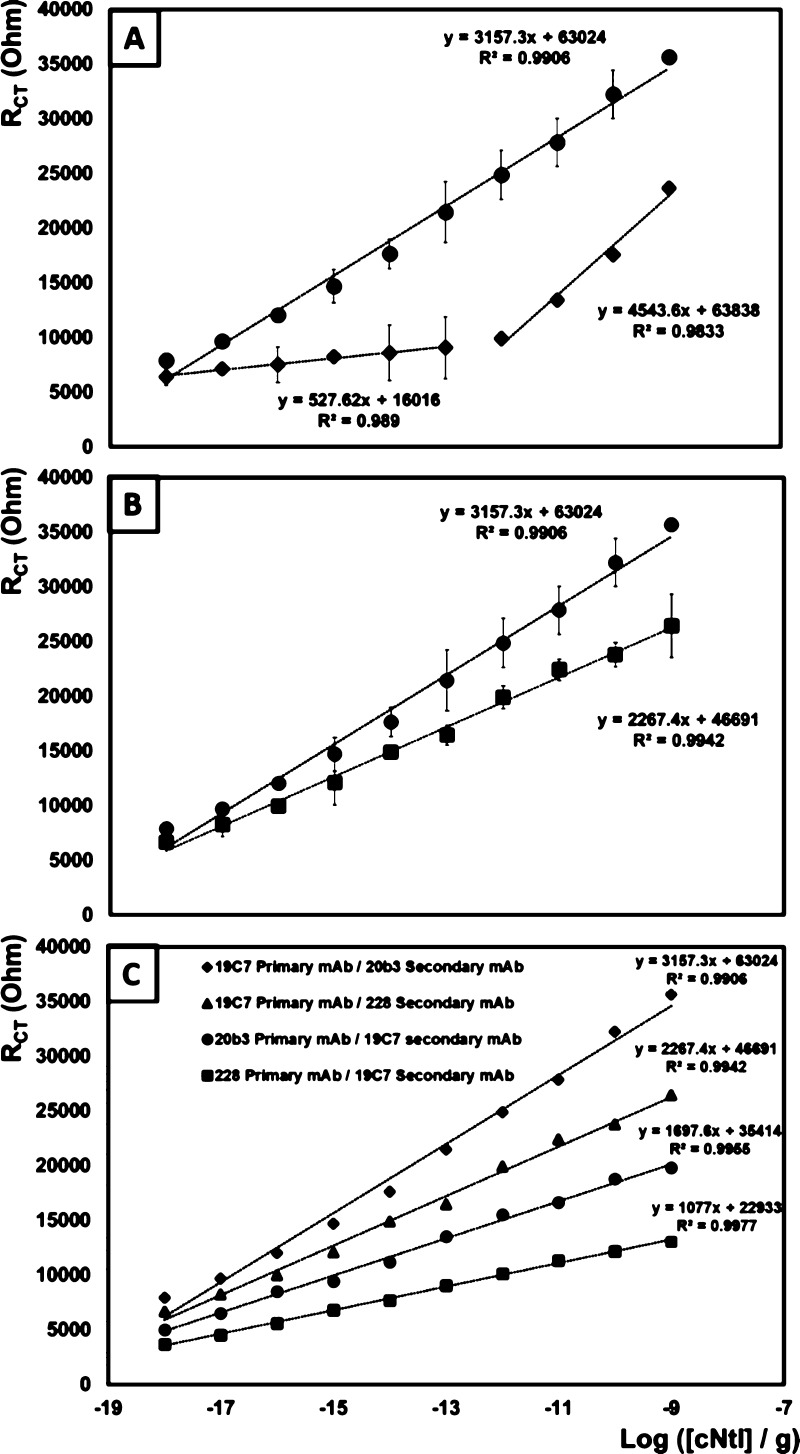
Figure 4.
(A) Linear regression of anti-cNtI (Hytest 19C7, epitope region 41–49) following exposure to increasing cTnI target (◊, 1 ag/mL to 1 ng/mL) and after immobilization of the Ir(III)-labeled in-house mAb 20B3 (●) and (B) commercially available mAb 228 (■) secondary antibody. (C) Linear regression plots of four sandwich immunoassays with in-house-generated and commercially available antibodies, following exposure to the cTnI target (1 ag/mL to 1 ng/mL) and Ir(III)-labeled secondary antibody. In all cases, the supporting electrolyte is 1 mM DPBS and EIS was recorded between 0.01 and 100 000 Hz using an ac amplitude of 25 mV and the dc potential set to the OCP (N = 3).

