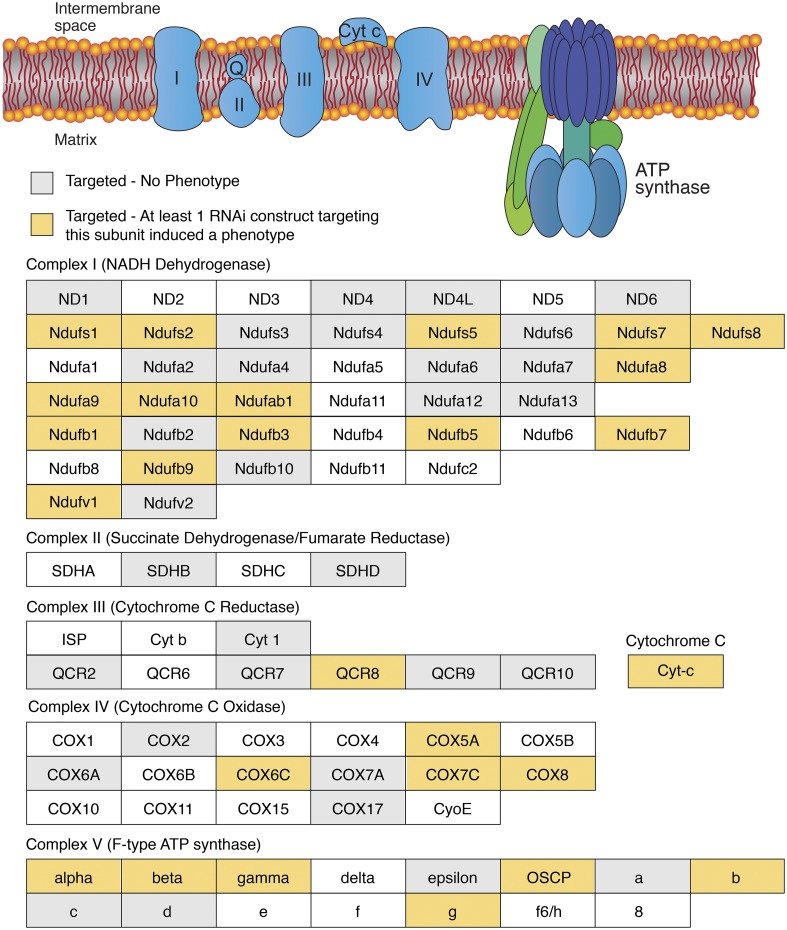
Figure 2.
The ETC and ATP synthase are required for normal eye development. (Top) A diagram illustrating the ETC and ATP synthase within the inner mitochondrial membrane. (Below) Individual subunits are listed in boxes and organized by complex. Yellow-shaded boxes indicate that at least one RNAi transgene targeting the subunit induced a phenotype. Gray-shaded boxes indicate that none of the RNAi transgenes targeting this subunit induced a phenotype. Corresponding data can be found in Table S4. Diagram is a modified from the illustration presented on the KEGG website for pathway dme00190.

