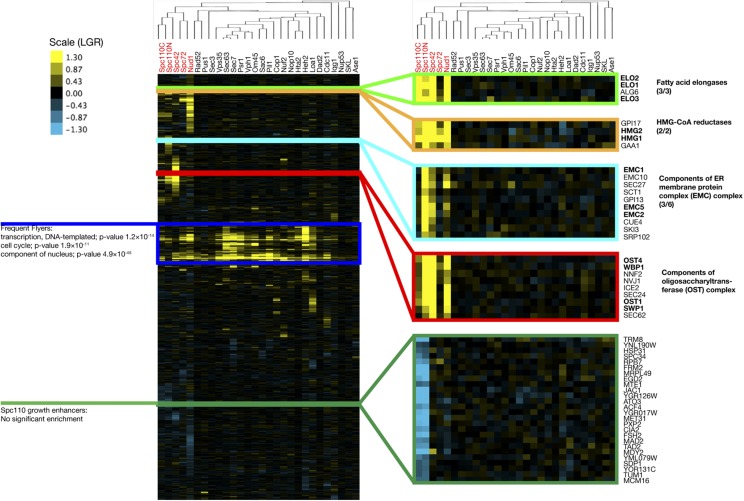
Figure 4.
Cluster analysis of all 28 SPI screens used in this study. The data are clustered both vertically (by GFP strain) and horizontally (by screen, tree shown). The horizontal clustering tree shows that the SPB screen results are more similar to each other than the other screens. The vertical clustering identifies clusters of biologically related proteins with similar profiles of sensitivity to forcible relocalization.

