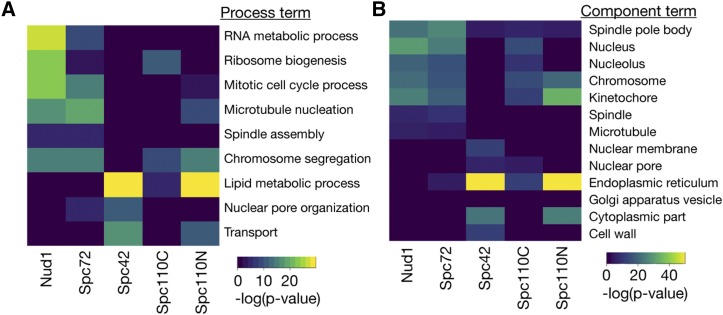
Figure 6.
GO analysis of SPB SPI screens, performed using the entire, ranked dataset. A: Heatmap of process GO analysis, dark blue tiles represent no significant enrichment while the lighter colors represent significant enrichment, with warmer tones representing higher p-values. B: Heatmap of component GO analysis.

