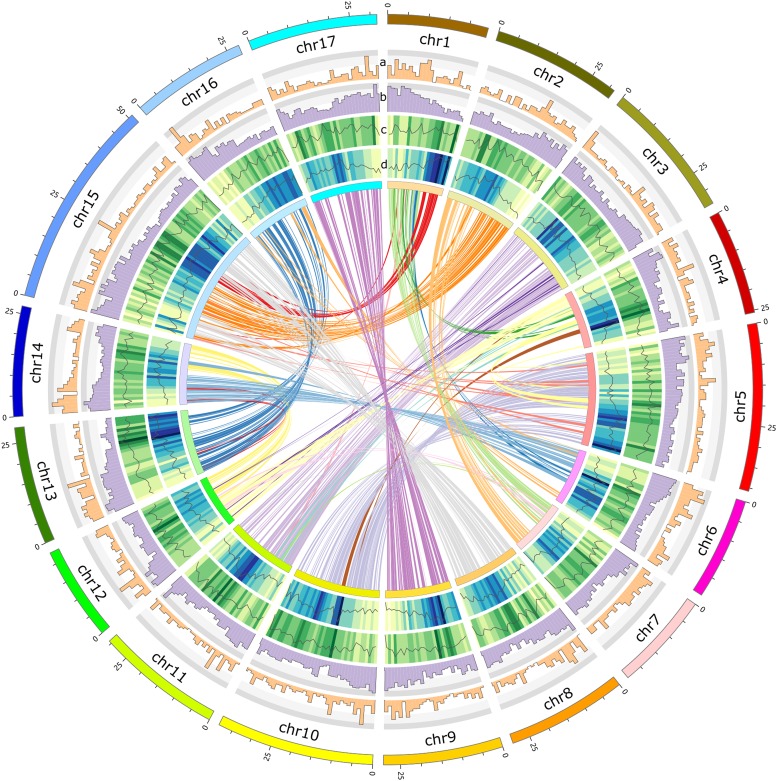
Figure 2.
Global view of the M. baccata genome. Transcription factor density (track a); gene density (track b); LTR-Gypsy number density (line) and size density (heat map) (track c); LTR-Copia number density (line) and size density (heat map) (track d). The innermost circle represents ideograms of 17 pseudochromosomes and the syntenic relationships of gene blocks from different pseudochromosomes.

