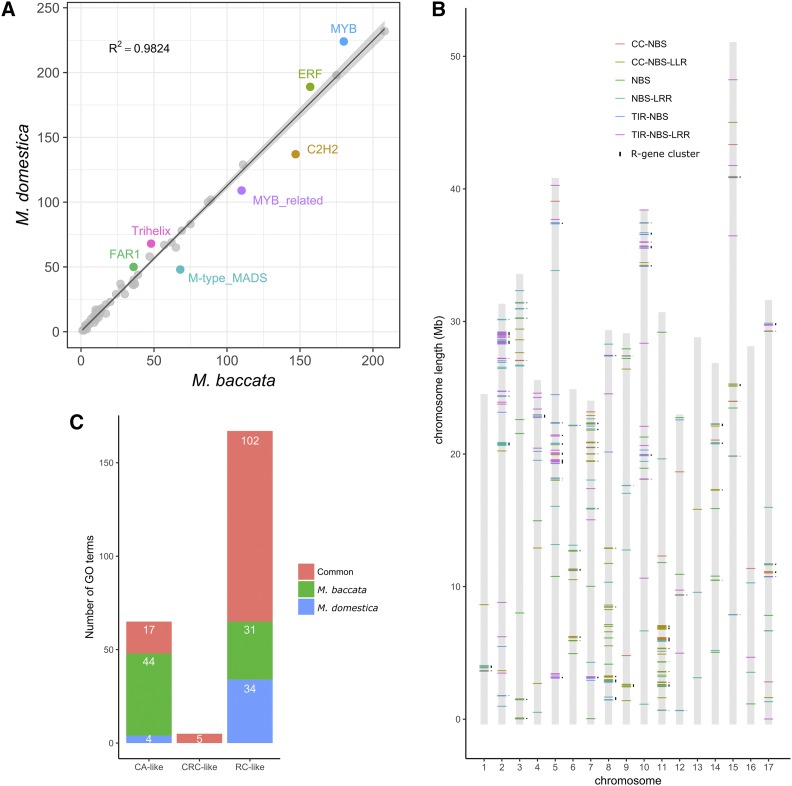
Figure 4.
Transcription factor, R gene cluster and cold-responsive genes in M. baccata genome. (A) Transcription factor families with more than 50 members in M. baccata and M. domestica. The confidence interval (P = 0.01) of the regression curve is indicated (lines and shadow). Transcription factor families (with more than 50 members) that deviate significantly from the regression curve are indicated. (B) Distribution of R gene clusters along M. baccata chromosomes. Different colored horizontal bars represent different kinds of NBS R genes. The NBS R gene clusters are indicated next to the vertical bars representing chromosomes. (C) Results of GO analyses of the M. baccata and M. domestica COR (cold-responsive) genes. CA, cold acclimation; CRC, cellular response to cold; RC, response to cold.

