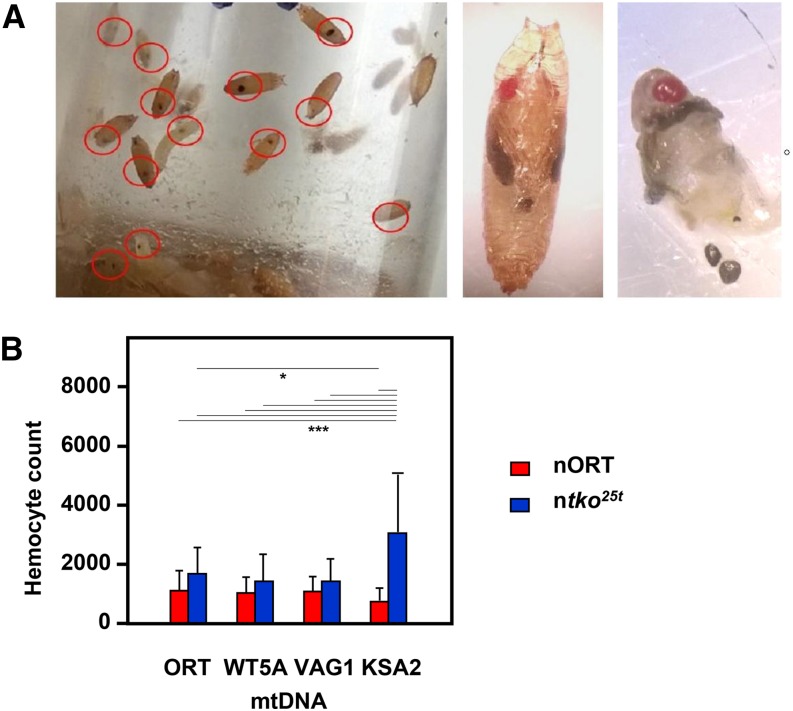
Figure 2.
Hemolymph abnormalities in cybrid lines (A) Images of ntko25t mtKSA2 flies during wandering L3 and pupal stage. Red ellipses (left-hand panel) are drawn around an example of melanotic nodules. After dissection (right-hand panel), most nodules were observed to be free of association with any specific tissue. (B) Total hemocyte counts from hemolymph of individual L3 larvae from indicated cybrids (means ± SD of at least 15 larvae of each genotype). Results of ANOVA followed by Tukey post hoc HSD test indicated by horizontal lines joining values showing significant differences (95% CI, *, *** denoting P < 0.05 or < 0.001 respectively).

