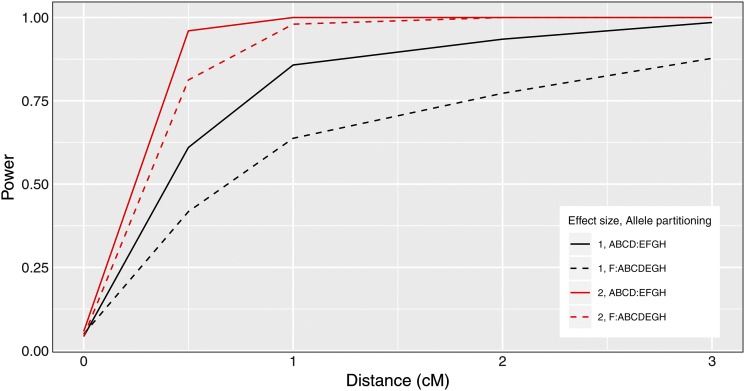
Figure 1.
Pleiotropy vs. separate QTL power curves for each of four sets of parameter settings. Factors that differ among the four curves are allele effects difference and allele partitioning. Red denotes high allele effects difference, while black is the low allele effects difference. Solid line denotes the even allele partitioning (ABCD:EFGH), while dashed line denotes the uneven allele partitioning (F:ABCDEGH).

