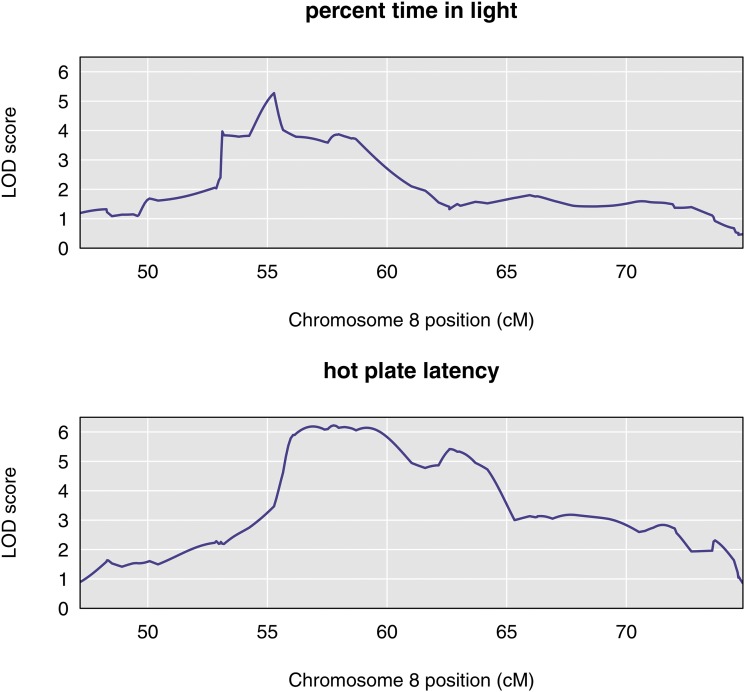
Figure 2.
Chromosome 8 univariate LOD scores for percent time in light and hot plate latency reveal broad, overlapping peaks between 53 cM and 64 cM. The peak for percent time in light spans the region from approximately 53 cM to 60 cM, with a maximum near 55 cM. The peak for hot plate latency begins near 56 cM and ends about 64 cM.

