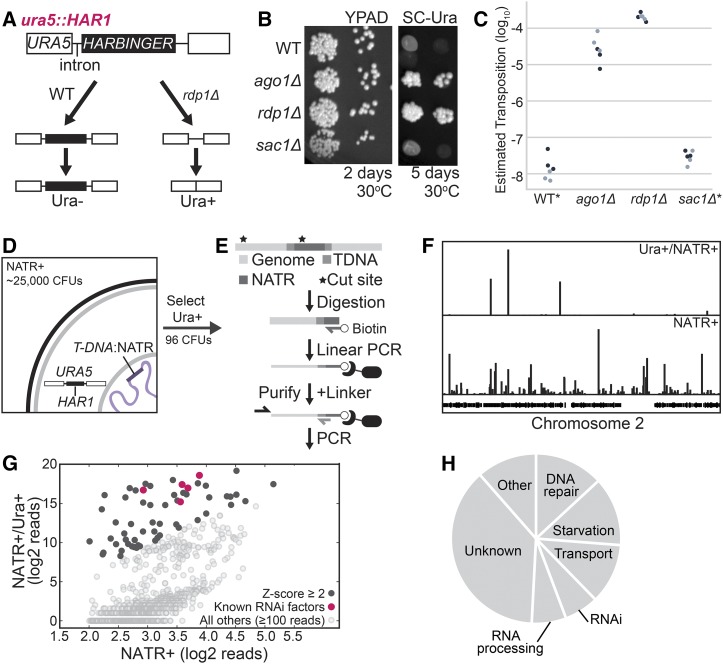
Figure 1.
A. A copy of the HARBINGER transposon (HAR1) was inserted into the second intron of URA5, resulting in failure to splice and uracil auxotrophy when the RNAi pathway is functional. Upon loss of RNAi (rdp1Δ), transposition may occur and some cells are able to synthesize uracil. B. Mobilization of HARBINGER in the presence of RNAi pathway knockouts. 1/10 dilutions of log phase cultures were spotted on YPAD or SC-Ura and incubated at 30°C for 2 or 5 days. C. Quantitation of HARBINGER mobilization. CFUs were counted after 2 days (YPAD) or 6 days (SC-Ura) at 30°C. Ura+ CFUs were then normalized to YPAD CFUs. *No colonies in WT and sac1 genotypes were detected on SC-Ura by the end 6 days, so a maximum estimated transposition rate is indicated. D. Schematic of the insertional mutagenesis strategy used for screening. Cells co-cultured with Agrobacteria carrying a T-DNA:NATR transposable element were selected for resistance to NAT, then for the ability to grow on media lacking uracil. E. Sequencing strategy for identifying T-DNA insertions. C. neoformans genomic DNA was fragmented by sonication and then ssDNA against the insertion site was generated by linear amplification. The biotinylated ssDNA product was purified, a DNA linker of known sequence was added to the 5′ end and the genomic flank was amplified by nested PCR. F. Mapping of insertion sites to the C. neoformans genome in the NAT resistant uracil prototrophic pool (NATR+/Ura+) vs. NAT resistant pool (NATR+). G. Quantitative comparison of the number of reads spanning the T-DNA boundaries for insertions within annotated genes for NATR+ and NATR+/Ura+ pools. Z-scores were determined from the distribution of the log2 ratio of reads from the NATR+/Ura+ pool over reads from the NATR+ pool. H. Functional classification of genes with enriched insertions in the HARBINGER mobilization screen based on FungiDB and hand-curated annotations.

