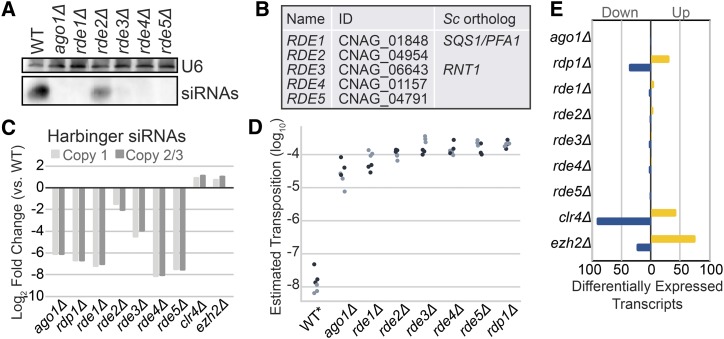
Figure 2.
A. siRNA Northern analysis of screen hits. Shown are those with a qualitatively apparent loss of siRNAs. Total RNA from each strain was separated by denaturing PAGE, transferred, chemically crosslinked and probed for siRNAs against CNAG_6705 with a Dig-labeled riboprobe. The loading control, U6 snRNA, was detected with a Dig-labeled DNA oligo against the C. neoformans U6 sequence. B. Names, gene identifiers and orthologs from S. cerevisiae (Sc) as determined by PSI blast (Altschul et al. 1997). C. Quantitation of the fold change in siRNAs against each HARBINGER locus (Copy 1: CNAG_00903, Copy 2/3: CNAG_02711 and CNAG_00549) as determined by small RNA-seq. Two copies of HARBINGER are virtually identical (Copy 2/3) and thus reads map to both with roughly equivalent frequency in our alignment strategy (see methods). D. Estimated transposition rate of HARBINGER in knockouts of each of the newly discovered factors. Assay conducted as described in Figure 1 legend. E. Differential expression of mRNA in C. neoformans (QuantSeq). Transcripts were determined to be significantly differentially expressed if they exhibit at least a twofold increase (yellow) or decrease (blue) in expression with an adjusted p-value of at most 0.01 (as determined by DESeq2, 2 replicates).

