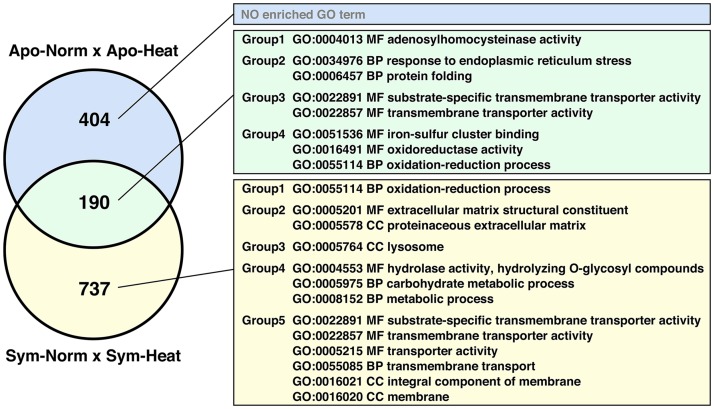
Figure 2 .
E. diaphana genes differentially expressed under heat stress in symbiotic and apo-symbiotic states. Venn diagram presents comparisons of the numbers of DEGs in each symbiotic state. Enriched GO terms also are shown for each compartment of the diagram. BP, biological process; CC, cellular component; MF, molecular function.

