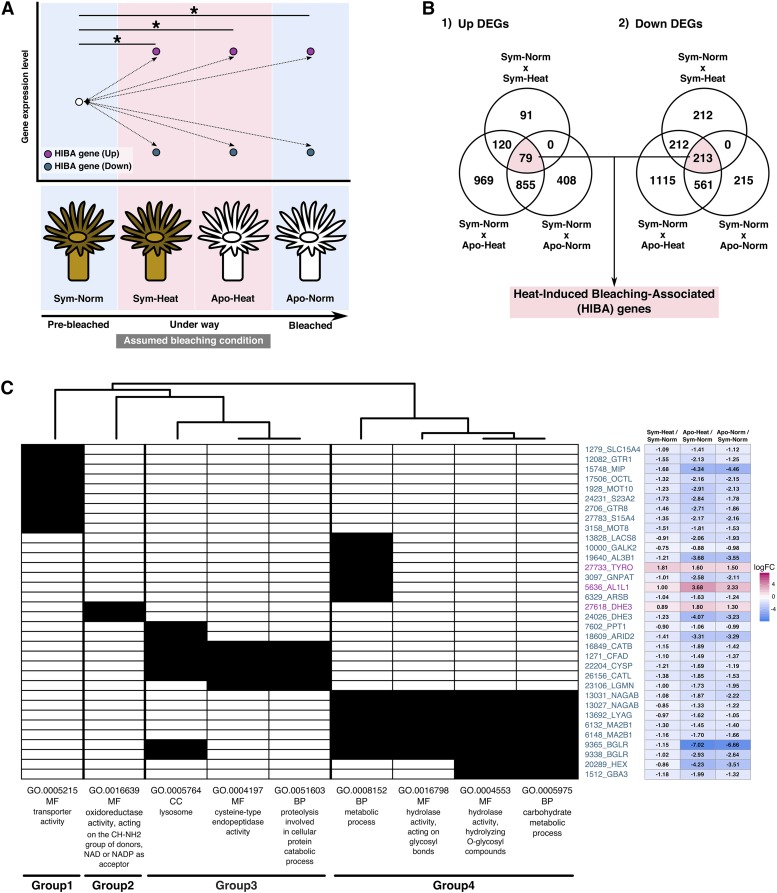
Figure 3.
Expression patterns of HIBA genes. A. Conceptual representation of HIBA gene definition. HIBA genes are defined as DEGs of which all the expression levels in Sym-Heat, Apo-Heat, and Apo-Norm have been changed in the same direction in comparison with Sym-Norm. Assumed bleaching conditions are shown along with sample conditions. Asterisks indicate significantly differential gene expression. B. Venn diagram presents the numbers of DEGs in multiple comparisons. ‘Up’ and ‘Down’ DEGs indicate the ones up-regulated and down-regulated relative to Sym-Norm, respectively. C. Presence–absence matrix of HIBA genes associated with enriched GO terms. HIBA genes are shown with ‘AIPGENE’ gene IDs and putatively annotated gene names on the vertical axis, with a heat map showing gene expression levels as log FC values. Gene IDs shown in magenta and teal blue are up- and down-regulated genes relative to Sym-Norm. Enriched GO terms are shown with GO ID, GO category and description on the horizontal axis, with a clustering based on the genes presented in each GO term column. Closed and open cells indicate the presence and absence of the association with GO terms.

