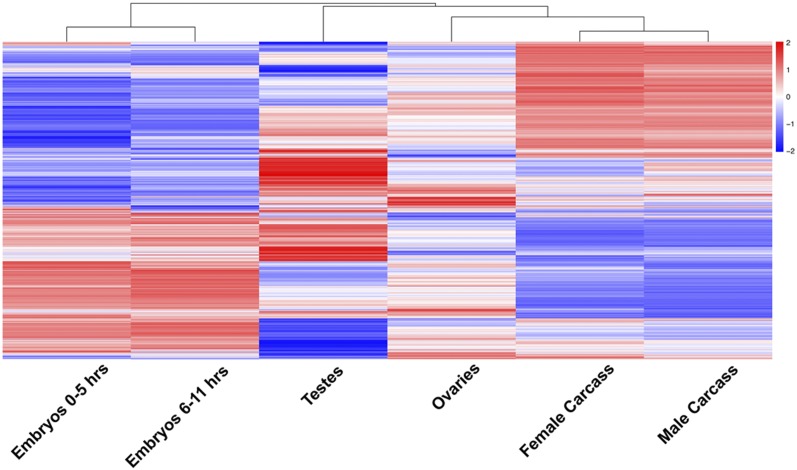
Figure 1.
Gene expression pattern revealed by clustering analysis in early embryo and different tissues. Clustering of normalized differentially expressed genes in Tribolium based on heat map analysis made using pheatmap package in ‘R’. Euclidean distance was used to estimate pairwise sample distances and sample clustering was done using the k-means algorithm. The columns of the heat map figure indicate samples and the rows represent different genes. The bar color reflects the gene expression levels as TMM normalized log-CPM. Color key indicates the intensity associated with normalized expression values. Red and Blue colors indicate higher expression and lower expression respectively.

